The Economic Impacts of Trump Administration's Tariffs
by World & New World Journal Policy Team
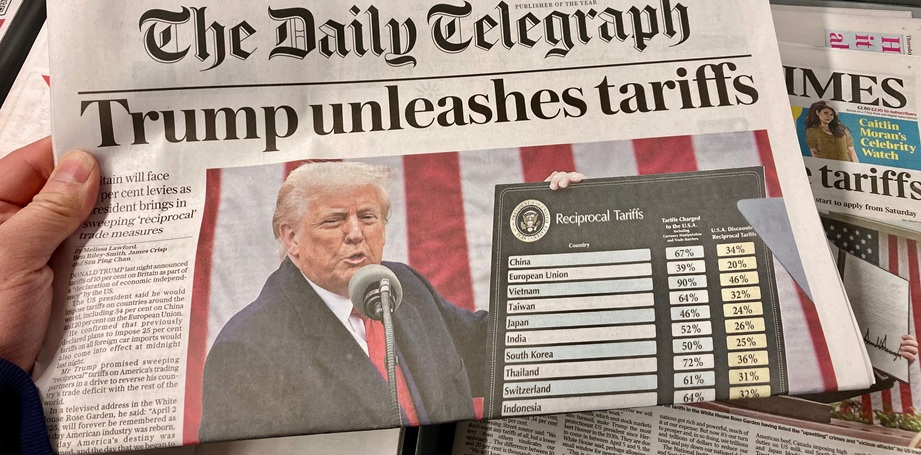
한국어로 읽기 Leer en español In Deutsch lesen Gap اقرأ بالعربية Lire en français Читать на русском I. Introduction We are only two and a half months into the new Trump administration. However, President Donald Trump's long-threatened tariffs have plunged the country into a trade war abroad. On-again, off-again, new tariffs continue to escalate uncertainty around the world. Trump already launched a trade war during his first term in office, but he has more sweeping tariff plans right now. The second Trump administration has embarked on a new and more aggressive tariff policy, citing various economic and national security concerns. His administration has proposed, imposed, suspended, revoked, and then reimposed various new tariffs. It could be difficult for average citizens to keep up with all the proposals. As of March 19, 2025, there are ten proposed or active tariff initiatives. They range from broad-based tariffs that cover all goods from a certain country (China, Mexico, Canada) to tariffs that cover certain types of goods (aluminum & steel), promises of future tariffs (copper, lumber, automotive, semiconductor, and pharmaceutical), and promised retaliatory tariffs (European wine and other alcoholic beverages). Moreover, although we have seen more tariff announcements in the first two months of the second Trump administration than in the entire first Trump administration, "fair and reciprocal" tariff rollout will overpower the tariffs imposed until today. The ten tariff initiatives that are proposed or in play are as follows in Table 1. This paper aims to evaluate economic impacts of tariffs imposed by the Trump administration. It first explains the effects of tariffs imposed by the first Trump administration and then forecasts the impacts of the second Trump administration's tariffs. II. Literature on Tariff Effects A tariff is a type of tax that a government adds to imported goods. Companies importing goods pay the tariff to the government. If any part of a product arrives with a tariff, whether it is an imported avocado or a car built locally with imported steel, its cost is part of the price everyday consumers pay before sales tax. Economists reject tariffs as an effective tool to improve the welfare of U.S. citizens or strengthen key industries. In a survey conducted during the first Trump administration, 93 % of economic experts did not agree that targeted tariffs on aluminium and steel would improve Americans' welfare. Recent research has strengthened economists' opposition to this policy instrument. Numerous studies demonstrate that American consumers entirely bear the burden of tariffs imposed during the first Trump administration, with disproportionately large impacts on lower-income U.S. households. A framework for analysing the impact of higher import tariffs on the economy is provided by Mundell and Fleming. Mundell (1961) claimed that the country that raised tariffs on imported products may benefit because more people choose domestically produced products over imported ones. Protection from foreign competition could also benefit domestic industries. Large countries can also benefit from improved terms of trade. However, increased tariffs on imported products are assumed to lead to an increase in the current account balance by increasing savings relative to investment. Higher savings dampen aggregate demand. The situation of households deteriorates because of rising consumer prices. Domestic industries are also negatively affected by lower household demand and the need to pay more for imported input products. Over the years, Mundell and Fleming's model has been developed further by other scholars such as Eichengreen (1981), Krugman (1982), Obstfeld and Rogoff (1995) and Eichengreen (2018). Overall, the theoretical literature demonstrates that higher import tariffs could affect the economy through various channels. The impacts of tariffs on the economy differ between a nation imposing the tariffs and nations exporting to the nation raising the tariffs. However, nations that are not subject to the increased import duties are also affected. Main effects of higher tariffs are as follows: Higher inflation: Higher import tariffs lead to higher prices for imported products. Depending on which tariffs are increased, this could lead to higher prices for both consumers and companies. Domestic firms may also raise their prices because of reduced competition from foreign companies (Cavallo et al. (2021)). Higher consumer prices lead to a decline in real disposable household income, which hampers private consumption. Higher business costs have impacts on companies' profits, which in turn dampen employment and companies' willingness to invest. Companies are also more likely to pass on some of their higher costs to consumers in the form of higher prices. The rise in imported prices might be smaller in large countries, as they are more able to influence the world price of products. Increased consumption of other products: Higher imported prices can lead companies and consumers to increasingly buy cheaper domestic products. But it can also lead to increased imports of products from countries not subject to higher import tariffs. Domestic industries are protected: Higher import tariffs improve the competitive position of domestic companies. These benefits can lead to increased investment, production, and employment in protected industries. However, the longer-term effect of protecting some domestic industries from foreign competition can be negative, as it might reduce incentives to improve production efficiency, thereby dampening productivity and GDP. Decreased trade: Increased tariffs usually lead to reduced trade. This can lead to reduced knowledge transfer between nations in the form of less direct investment, reduced technology transfer, and reduced access to skilled labour. These factors in turn can lead to companies moving further away from the technological frontier, thereby hampering productivity (Dornbusch (1992) and Frankel and Romer (1999)). Stronger exchange rate: When demand changes from foreign to domestic production, the exchange rate tends to rise to balance it out. One reason is that higher inflation often leads to higher interest rates relative to other nations. The nominal exchange rate might appreciate if imports decline significantly and demand for foreign currency drops. An appreciation of the exchange rate hampers exports but keeps imports cheaper. Global value chains: Higher tariffs can lead to disruptions in global value chains by making imported inputs from abroad pricier. If firms are part of global value chains, higher costs for firms facing higher import costs may also lead to higher costs for domestic firms further down the production chain. Uncertainty and confidence: Higher import tariffs may increase uncertainty about future trade policy and lead to increased pessimism among households and companies. Such uncertainty may hamper household consumption and business investment (Boer and Rieth (2024)). III. Tariffs under the first Trump administration The first Trump administration's tariffs involved protectionist trade initiatives against other nations, notably China. In January 2018, the Trump administration-imposed tariffs on solar panels and washing machines of 30–50%. In March 2018, the administration-imposed tariffs on aluminium (10%) and steel (25%), which are imported from most countries. In June 2018, the Administration expanded these tariffs to include the EU, Mexico, and Canada. The Trump administration separately set and escalated tariffs on products imported from China, leading to a trade war between the U.S. and China. In their responses, U.S. trading partners imposed retaliatory tariffs on U.S. products. Canada imposed matching retaliatory tariffs on July 1, 2018. China implemented retaliatory tariffs equivalent to the $34 billion tariff imposed on it by the U.S. In June 2019, India imposed retaliatory tariffs on $240 million worth of U.S. products. However, tariff negotiations in North America were under way and successful, with the U.S. lifting steel and aluminium tariffs on Mexico and Canada on May 20, 2019. Mexico and Canada joined Argentina and Australia, which were the only countries exempted from the tariffs. But on May 30, Trump announced on his own that he would put a 5% tariff on all imports from Mexico starting on June 10, 2019. The tariffs would go up to 10% on July 1, and then by another 5% every month for three months, until illegal immigrants stopped coming through Mexico and into the U.S. Then the tariffs were averted on June 7 after negotiations between the U.S. and Mexico. U.S. tariffs on Chinese products had been applied as follows: On March 22, 2018, Trump signed a memorandum under Section 301 of the Trade Act of 1974 to apply tariffs of $50 billion on Chinese products. In response, China announced plans to implement its tariffs on 128 U.S. products. 120 of those products, such as fruit and wine, will be taxed at a 15% duty, while the remaining eight products, including pork, will receive a 25% tariff. China implemented their tariffs on April 2, 2018. On April 3, 2018, the U.S. Trade Representative's office (the USTR) published an initial list of 1,300+ Chinese products to impose levies upon products like flat-screen televisions, medical devices, aircraft parts and batteries. On April 4, 2018, China's Customs Tariff Commission of the State Council decided to announce a plan to put 25% more tariffs on 106 U.S. goods, such as soybeans and cars. In the response, On April 5, 2018, President Trump directed the USTR to consider $100 billion in additional tariffs. On May 9, 2018, China cancelled soybean orders exported from the United States to China. On June 15, 2018, President Trump released a list of Chinese products worth $34 billion that would face a 25% tariff, starting on July 6. Another list with $16 billion of Chinese products was released, with an implementation date of August 23. On July 10, 2018, in reaction to China's retaliatory tariffs that took effect July 6, the USTR issued a proposed list of Chinese products amounting to an annual trade value of about $200 billion that would be subjected to an additional 10% in duties. During the G20 summit in Japan in June 2019, the U.S. and China agreed to resume stalled trade talks, with Trump announcing he would suspend an additional $300 billion in tariffs that had been under consideration. IV. Economic Effects of the Tariffs from the First Trump Administration Changes in tariffs affect economic activity directly by influencing the price of imported products and indirectly through changes in exchange rates and real incomes. The extent of the price change and its impact on trade flows, employment, and production in the United States and abroad depend on resource constraints and how various economic actors (producers of domestic substitutes, foreign producers of the goods subject to the tariffs, producers in downstream industries, and consumers) respond as the effects of the increased tariffs reverberate throughout the economy. According to the U.S. Congressional Research Service (CRS), the following six outcomes came out at the level of individual firms and consumers as well as at the level of the national economy. 1. Increased costs for U.S. consumers Higher tariff rates lead to price increases for consumers of products subject to the tariffs and for consumers of downstream products as input costs rise. Higher prices in turn lead to decreased consumption, depending on consumers' price sensitivity for a particular product. For example, consider the monthly price of U.S. laundry equipment, which includes washing machines subject to tariff increases as high as 50% since February 2018. The monthly price of this equipment increased by as much as 14% in 2018 compared to the average price level in 2017, before the tariffs took effect (see Figure 1). Figure 1: U.S. laundry equipment prices According to Jin (2023), many companies passed the costs of the Trump tariffs on to consumers in the form of higher prices. Following impositions of the tariffs on Chinese products, the prices of U.S. intermediate goods rose by 10% to 30%, an amount equivalent to the size of the tariffs. An April 2019 working paper by Flaaen, Hortaçsu, and Tintel not found that the tariffs on washing machines caused the prices of washers to rise by approximately 12% in the United States. A Goldman Sachs analysis by Fitzgerald in May 2019 found that the consumer price index (CPI) for tariffed products had increased dramatically, compared to a declining CPI for all other core goods. According to the Guardian, the Budget Lab at Yale University found that American consumer prices could rise by 1.4% to 5.1% if Trump implemented his comprehensive tariff plan, which would amount to an additional $1,900 to $7,600 per household. 2. Decreased domestic demand for imported goods subject to the tariffs and less competition for U.S. producers of substitute goods: U.S. producers competing with the imported products subject to the tariffs (e.g., domestic aluminium and steel producers) may benefit to the degree they are able to charge higher prices for their domestic products and may expand production because of increased profitability. Since March 2018, U.S. imports of steel and aluminium have faced additional tariff charges of 25% and 10%, making foreign supplies of these products more expensive relative to domestic products. Because of these tariffs, U.S. imports of these goods went down in 2018 and 2019 compared to what they were usually like in 2017 before the tariffs, while U.S. production went up (see Figure 2 and Figure 3). By the first quarter of 2020, real U.S. imports of steel and aluminium (adjusted for price fluctuations) had decreased by more than 30% and 16%, respectively, from their average 2017 levels. The quarterly production of steel and aluminium in the U.S. during this period, however, increased by as much as 13.5% and 9.0%, respectively, above average 2017 levels. Figure 2: Domestic production and imports: Steel Figure 3: Domestic production and imports: Aluminium 3. Increased costs for U.S. producers in downstream industries, resulting in a decline in employment U.S. producers that use imported products subject to the additional tariffs as inputs ("downstream" industries, such as auto manufacturers in the case of the aluminium and steel tariffs) might be harmed as their costs of production increase. Higher input costs are more likely to lead to some combination of lower profits for producers, which in turn might dampen demand for these downstream products, leading to some contraction in these sectors. A study (2019) by Federal Reserve Board economists Flaaen and Pierce, which examined effects on the manufacturing sector from all U.S. tariff actions in 2018, found that higher input costs from the tariffs were associated with higher prices, employment declines, and reductions in output for affected firms. Another study (2020) by Handley, Kamal, and Monarch found that the higher input costs associated with the tariffs might have led to a decrease in U.S. exports for firms reliant on imported intermediate inputs. Handley, Kamal, and Monarch suggested that export growth was approximately 2% lower for products made with products subject to higher U.S. tariffs, relative to unaffected products. Another study (2019) by Federal Reserve Board economists Flaaen and Pierce found that the steel tariffs led to 0.6% fewer jobs in the manufacturing sector than would have happened in the absence of the tariffs; this cut amounted to approximately 75,000 jobs. A study (2024) by Ma and David concluded that the United States lost 245,000 jobs because of the Trump tariffs. 4. Decreased demand for U.S. exports subject to retaliatory tariffs Retaliatory tariffs place U.S. exporters at a price disadvantage in export markets relative to competitors from other countries, potentially decreasing demand for U.S. exports to those markets. Since Q3 2018, after Section 232 retaliatory tariffs took effect in China, the EU, Russia, and Türkiye, U.S. exports to these trading partners subject to the tariffs declined by as much as 44% below their 2017 average values (Figure 4). U.S. exports to China subject to retaliation during the same period declined even further from their 2017 levels, falling as much as 68% on a quarterly basis. By contrast, during this same period, overall U.S. exports were as much as 10% higher each quarter relative to 2017, suggesting the retaliatory tariffs played a role in the product-specific export declines. Figure 4: Declines in U.S. exports subject to retaliation A study by Fajgelbaum, Goldberg, Kennedy, and Khandelwal published in the Quarterly Journal of Economics in October 2019 estimated that consumers and firms in the U.S. who buy imports lost $51 billion (0.27% of GDP) because of the 2018 tariffs. This study also found that retaliatory tariffs resulted in a 9.9% decline in U.S. exports. This study also found that workers in counties with a lot of Republicans were hurt the most by the trade war because agricultural products were hit the hardest by retaliatory tariffs. 5. U.S. National Economy In addition to industry- or consumer-level effects, tariffs also have the potential to affect the broader U.S. national economy. Quantitative estimates of the effects vary based on modelling assumptions and techniques, but most studies suggest a negative overall impact on U.S. GDP because of the tariffs. The Congressional Budget Office (2020) estimated that the increased tariffs in effect as of December 2019 would reduce U.S. GDP by 0.5% in 2020, below a baseline without the tariffs, while raising consumer prices by 0.5%, thereby reducing average real household income by $1,277. From a global perspective, the International Monetary Fund estimated that the tariffs would reduce global GDP in 2020 by 0.8%. Dario Caldara et al. (2020) also found that in 2018, investment dropped by 1.5% because of the uncertainty caused by U.S. trade policy. Moreover, a study (2019) by Amiti, Redding, and David published in the Journal of Economic Perspectives found that by December 2018, Trump's tariffs resulted in a reduction in aggregate U.S. real income of $1.4 billion per month in deadweight losses and cost U.S. consumers an additional $3.2 billion per month in added tax. Furthermore, Russ (2019) found that tariffs, which Trump imposed through mid-2019, combined with the policy uncertainty they created, would reduce the 2020 real GDP growth rate by one percentage point. 6. Trade balance The Trump administration repeatedly raised concerns over the size of the U.S. trade deficit, thereby making trade deficit reduction a stated objective in negotiations for new U.S. trade agreements. Broad-based tariff increases affecting a large share of imports may reduce imports initially, but they are unlikely to reduce the overall trade deficit over the longer period due to at least two indirect impacts that counteract the initial reduction in imports. One indirect effect is a potential change in the value of the U.S. dollar relative to foreign currencies. Another potential effect of U.S. import tariffs is retaliatory tariffs. Economists argue that while tariffs placed on imports from a limited number of trading partners may reduce the bilateral U.S. trade deficit with those specific nations, this is likely to be offset by an increase in the trade deficit or reduction in the trade surplus with other nations, leaving the total U.S. trade deficit largely unchanged. Figure 5 shows the relative change in the U.S. goods trade deficit with the world as well as the bilateral U.S. deficits with three major partners, China, Mexico, and Vietnam, from 2017 to 2019. Since the U.S. tariffs took effect, the overall U.S. trade deficit has increased, rising 8% from 2017 to 2019. However, the U.S. trade deficit in goods with China declined by 8% from 2017 to 2019, while the U.S. trade deficit in goods with Vietnam and Mexico significantly increased by more than 40% during the same period. Figure 5: Changes in the U.S. goods trade deficits with China, Mexico, and Vietnam According to Zarroli (2019), between the time Trump took office in 2017 and March 2019, the U.S. trade deficit increased by $119 billion, reaching $621 billion, the highest it had been since 2008. American Farm Bureau Federation data showed that agriculture exports from the U.S. to China decreased from $19.5 billion in 2017 to $9.1 billion in 2018, a 53% reduction. V. What are the Potential Consequences of Trump's Tariff Plan? Last year, the Peterson Institute for International Economics examined the impact of President Trump's proposed tariffs based on his campaign promises, which would impose 10 % additional tariffs on US imports from all sources and 60 % additional tariffs on imports from China. The major outcomes were lower national income, lower employment, and higher inflation. McKibbin, Hogan, and Noland (2024) at the Peterson Institute for International Economics found that both of Trump's tariff plans—imposing 10% additional tariffs on U.S. imports from all sources and 60% additional tariffs on imports from China—would reduce both U.S. real GDP and employment by 2028. But the former proposal damages the U.S. economy more than the latter. If other nations retaliate with higher tariffs on their imports from the U.S., the damage intensifies. Assuming other governments respond in kind, Trump's 10 % increase results in U.S. real GDP that is 0.9 % lower than otherwise by 2026, and U.S. inflation rises 1.3 % above the baseline in 2025. The 10 % added tariffs hurt the economies of Canada, Mexico, China, Germany, and Japan—all major US trading partners that see a lower GDP relative to their baselines through 2040. Mexico and Canada take much larger GDP hits than the U.S. The 60 % added tariffs on imports from China reduce its GDP relative to its baseline, much more than that of other U.S. trading partners. Mexico, however, sees a higher GDP than otherwise as some production shifts to Mexico from China. This paper focuses on Trump's universal 10 % tariffs rather than 60 % tariffs on imports from China because extreme 60 % tariffs on Chinese imports are not expected. McKibbin, Hogan, and Noland (2024) assume the 10 % tariff increase is implemented in 2025 and remains in place through the forecast period. They also consider a second scenario in which U.S. trading partners retaliate with equivalent tariff increases on products they import from the U.S. Figures 6–11 show the results for the uniform additional 10 % increase in the tariff on imports of goods and services from all trading partners. Figure 6: Projected change in real GDP of selected economies from an additional 10 % increase in US tariffs on imports of goods and services from all trading partners, 2025-40 (Source: McKibbin, Hogan, and Noland, 2024) When tariffs go up by 10%, the U.S. real GDP goes down by 0.36 % by 2026, and it goes down even more in Mexico and Canada by 2027 (see Figure 6). Chinese GDP drops by 0.25 % below the baseline in 2025. After the initial demand-induced slowdown, U.S. GDP recovers as production shifts from foreign suppliers to U.S. suppliers, leading to a slightly lower long-term GDP of 0.1 % below baseline by 2030 in the U.S. Figure 7: Projected change in employment (hours worked) in selected economies from an additional 10 % increase in US tariffs on imports of goods and services from all trading partners, 2025-40 (Source: McKibbin, Hogan, and Noland, 2024) The results for aggregate employment are like the GDP outcomes (see figure 7). Employment drops in the United States by 0.6 % by 2026 but recovers due to a supply relocation towards U.S. suppliers. U.S. employment returns to baseline eventually because real wages decline permanently to bring employment back to baseline by assumption. Figure 8: Projected change in inflation in selected economies from an additional 10% increase in US tariffs on imports of goods and services from all trading partners, 2025-40 (Source: McKibbin, Hogan, and Noland, 2024) The imposition of higher tariffs increases prices of both consumer and intermediate goods, contributing to a rise in inflation of 0.6 % above baseline in 2025 (see figure 8). The higher tariff is inflationary everywhere except in China due to the tightening of Chinese monetary policy to resist change in the exchange rate relative to the U.S. dollar. Figure 9: Projected change in the trade balance in selected economies from an additional 10 % increase in US tariffs on imports of goods and services from all trading partners, 2025-40 (Source: McKibbin, Hogan, and Noland (2024)) Figure 9 shows the change in the trade balance as a share of GDP. In theory, the trade balance can worsen or improve due to changes in exports and imports. From 2025 to 2028, the U.S. trade deficit narrows slightly but then widens as capital flows into the U.S. economy, appreciating the U.S. real effective exchange rate. By 2030, the U.S. trade deficit will worsen by 0.1 % of GDP due to capital moving from Mexico and Canada into the U.S. Government savings rise due to additional tariff revenues. VI. Conclusion This paper showed that tariffs imposed by the first Trump administration had negative impacts on the U.S. economy, particularly inflation, incomes, and employment. It also demonstrated that tariffs which will be imposed by the second Trump administration are expected to have negative effects on the U.S. economy. Then a question arises: "Why does Trump attempt to impose tariffs on products from abroad?" Today, more people mention tariffs as tools to protect U.S. companies and farmers. They are discussed as a tool for bringing back manufacturing businesses into the U.S. as well as a bargaining tactic in negotiations over the flow of fentanyl and immigration. Trump has used and promised to increase tariffs for three purposes: to raise revenue, to bring trade into balance, and to bring rival countries to heel. It is unclear whether Trump will achieve his goals. However, President Donald Trump believes that tariffs are a panacea. Trump believes that his tariffs would bring hundreds of billions—trillions— into the US Treasury. Moreover, Trump is confident that he can force countries to give up something he believes is in America's best interest. For example, his tariffs on Canada and Mexico have led Mexico and Canada to agree to expand their border patrols. Reference Amiti Mary, Redding Stephen, David E, “The Impact of the 2018 Tariffs on Prices and Welfare,” Journal of Economic Perspectives. 33 (Fall 2019): 187–210. Boer, L. and M. Rieth, “The Macroeconomic Consequences of Import Tariffs and Trade Policy Uncertainty,” IMF Working Paper 2024/013, International Monetary Fund. Cavallo, A., G. Gopinath, B. Neiman, and J. Tang (2021), “Tariff Pass-Through at the Border and at the Store: Evidence from US Trade Policy,” American Economic Review: Insights 3(1): 19-34. Congressional Budget Office, The Budget and Economic Outlook: 2020 to 2030, January 28, 2020. https://www.cbo.gov/system/files/2020-01/56020-CBO-Outlook.pdf. Dario Caldara et al., “The Economic Effects of Trade Policy Uncertainty,” Journal of Monetary Economics, vol. 109 (January 2020), pp. 38-59. Dornbusch, R. (1992), “The Case for Trade Liberalization in Developing Countries,” Journal of Economic perspectives 6 (1): 69-85. De Loecker, J., P.K. Goldberg, A.K. Khandelwal and N. Pavcnik (2016), “prices, markups, and trade reform,” Econometrica 84(2): 445-510. Eichengreen, B. (1981), “A Dynamic Model of Tariffs and Employment under Flexible Exchange Rates,” Journal of International Economics 11:341-359. Eichengreen, B. (2018), “Trade Policy and the Macroeconomy,” Keynote address Mun dell-Fleming Lecture, International Monetary Fund, 13 March 2018. Fajgelbaum, P.D., P.K. Goldberg, P.J. Kennedy and A.K. Khandelwal (2019), “The Return to Protectionism,” The Quarterly Journal of Economics 135(1): 1-55. Fitzgerald, Maggie, “This Chart from the Goldman Sachs Shows Tariffs are Rasing Prices for Consumers and It could Get Worse.” CNBC. May 13, 2019. Flaaen, A. and J.R. Pierce (2019), “Disentangling the effects of the 2018-2019 tariffs on globally connected U.S. Manufacturing sector,” Working Paper, Finance Economic Discussion Series 2019-086, Board of Governors Federal Reserve System, Washington DC. Flaaen, A., A. Hortacsu and F. Tintelnot (2020), “The production relocation and price effects of US trade policy: the Case of Washing Machines,” American Economic Review 110(7): 2103-2127. Frankel, J.A. and D.H. Romer (1999), “Does Trade Cause Growth,” American Economic Review 89 (3): 379-399. Handley, K., F. Kamal, and R. Monarch (2020), “Rising Import Tariffs, Falling Export Growth: When Modern Supply Chains Meet Old-Style Protectionism,” NBER Working paper 26611. https://www.nber.org/papers/w26611. Handley, K. and N. Limao (2022), “Trade Policy Uncertainty,” NBER Working Paper 29672. Handley, Kyle, Fariha Kamal, and Ryan Monarch, “Rising Import Tariffs, Falling Export Growth: When Modern Supply Chains Meet Old-Style Protectionism,” National Bureau of Economic Research, NBER Working Paper No. 26611, January 2020. Jin, Keyu (2023). The New China Playbook: Beyond Socialism and Capitalism. New York: Viking. Kreuter, H. and M. Riccaboni (2023), “The Impact of Import Tariffs on GDP and Consumer Welfare: A Production Network Approach,” Journal of Economic Modelling 126. Krugman, P. (1982), “The Macroeconomics of Protection with a Floating Exchange rate,” Carnegie-Rochester Conference Series on Public Policy 16: 141-182. Ma, Xinru; Kang, David C. (2024). Beyond Power Transitions: The Lessons of East Asian History and the Future of U.S.-China Relations. Columbia Studies in International Order and Politics. New York: Columbia University Press. McKibbin, W., M. Hogan, and M. Noland (2024), “The International Economic Implications of a Second Trump Presidency,” Peterson Institute for International Economics, Working Paper 24-20. Mundell, R. (1961), “Flexible Exchange Rates and Employment Policy,” Canadian Journal of Economics and Political Science 27: 509-517. Obstfeld, M., and K. Rogoff (1995), “Exchange Rate Dynamics Redux,” Journal of Political Economy, 103: 624-660. Russ, Katheryn (December 16, 2019). “What Unilateralism Means for the Future of the U.S. Economy,” Harvard Business Review. January 2, 2020. Zarroli, Jim. “Despite Trump’s Promises, The Trade Deficit is Only Getting Wider,” NPR. March 6, 2019.


