Subscribe to our weekly newsletters for free

Subscribe to an email

If you want to subscribe to World & New World Newsletter, please enter
your e-mail

Energy & Economics
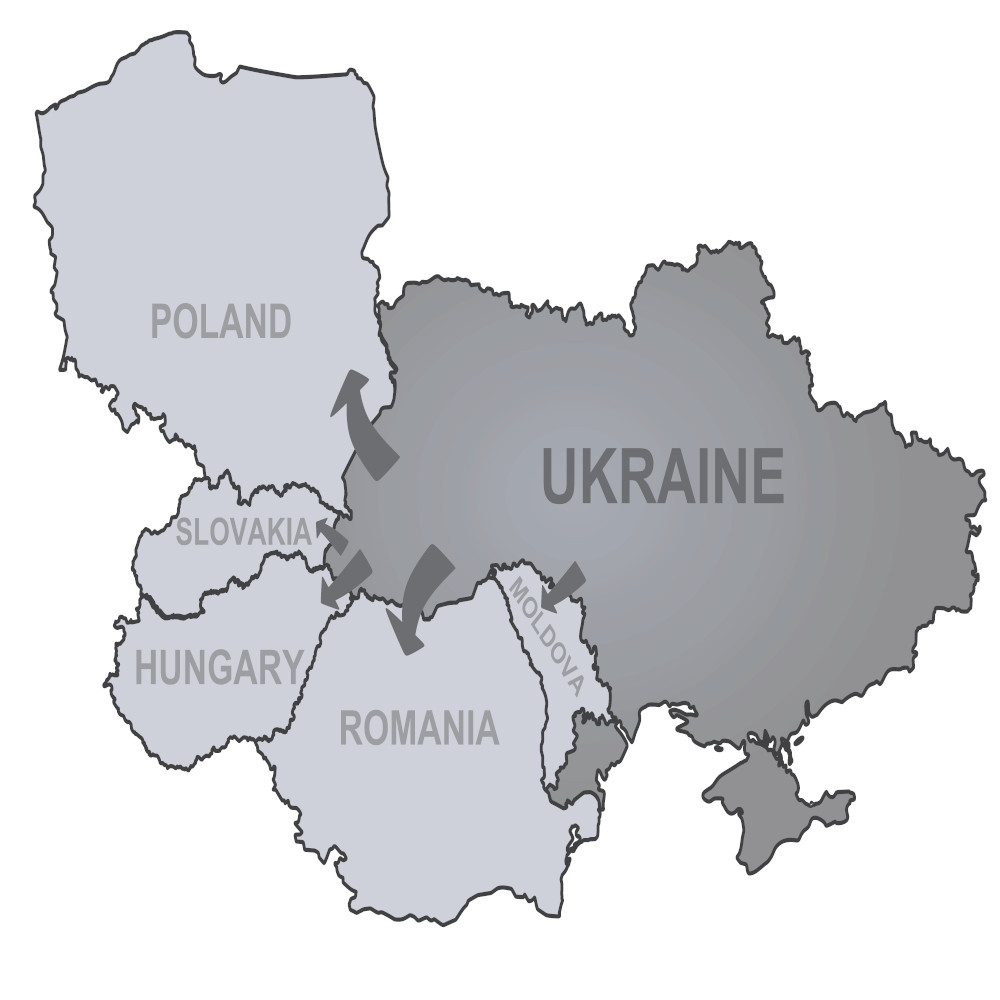
Ukraine refugees map to neighbors countries. vector

The Economic impacts of the Ukraine war on Eastern European countries with a focus on inflation and GDP growth

by World & New World Journal Policy Team

I. Introduction Russia invaded Ukraine in February 2022. As the Russian invasion of Ukraine enters its fourth year, its most immediate and visible consequences have been loss of life and large numbers of refugees from Ukraine. However, given the interconnected structure of the international political, economic, and policy systems, the ramifications of the Ukraine conflict can be felt well beyond Ukraine and Russia. Much of the recent literature and commentaries have focused on the military and strategic lessons learned from the on-going Ukraine conflict (Biddle 2022; 2023; Dijkstra et al. 2023). However, there are not many quality analyses of economic effects of the Ukraine war on Eastern European countries, including Russia and Ukraine. This paper focuses on the economic effects of the Ukraine war on nine Eastern European countries, including Russia and Ukraine. This is because although Eastern European countries are neighbors of Russia and Ukraine and have had significant negative economic outcomes from the Ukraine war, these countries were mainly ignored by researchers. II. The Economic Effects of the Ukraine war The impacts of war are far-reaching and devastating. War causes immense destruction of property and loss of life. It also creates psychological trauma for those who have experienced it firsthand. War can also have long-term economic impacts, such as higher unemployment and increased poverty. War can also lead to the displacement of people, as we have seen the millions of refugees who had been forced to flee their homes due to conflicts. War can also have political effects, such as creating new states or weakening existing nations. It can also lead to the rise of authoritarian regimes in many post-war nations. War can also lead to increased militarization as nations seek to protect themselves from future conflicts. The Ukraine war might have broader economic consequences. The supply chains may be affected because of the destruction of infrastructures and resources. War mobilization may affect the workforce and economic production. Actors in the economy may also act strategically to deploy resources elsewhere or to support the war effort because the war has affected incentive structures of workers and business. These effects can be local to geographical areas engulfed in conflict but also cause ripple effects to a wider regional area and to the global economy. Trade, production, consumption, inflation, growth and employment patterns may all be influenced. Peterson .K. Ozili.(2022) claimed that the scale of the Ukraine war had its negative impact on the economies of almost all countries around the world. According to Ozili, the main effects of the Ukraine war on the global economy are several, but this paper focuses on two below: Rising Oil Gas Prices  and inflation – European countries import a quarter of their oil and 40% of their natural gas from the Russian Federation. The Russian Federation is the second largest oil producer in the world and the largest supplier of natural gas to Europe, and after the invasion, European oil companies will have problems getting these resources from the Russian Federation. Even before the Russian invasion, oil prices were rising because of growing tensions between countries, the COVID-19 pandemic, and other factors, but remained in the $80–95 per barrel range. After the invasion, this price reached the value of $100. Natural gas prices rose 20% since the war began. Rising gas & oil prices can drive high inflation and increase public utility bills. Decline in production and economic growth. Rising oil and gas prices lead to high inflation and, therefore, a decline in consumption, supply and demand, thereby causing decline in growth and production. This paper focuses on inflation and GDP growth of nine Eastern European countries regarding the economic effects of the Ukraine war. Ozili (2022) claimed that very high inflation was a perceived negative consequence of the Russian invasion of Ukraine. As Figure 1 shows, inflation in the EU jumped in the first month of the invasion, and the increasing trend continues. EU inflation in 2022 peaked in October and amounted to 11.5% that was a historical record. However, inflation has slowly declined as energy prices have gone down. This higher inflation in Europe basically resulted from energy price increase. As Figures 2, 3, and 4 show, energy prices in Europe skyrocketed in 2022. As Figure 2 shows, energy prices have been the most important component of high inflation in the EU.  Figure 1: Average inflation rate in the EU (%). Source: EurostatCreated with Datawrapper     Figure 2: Main components of inflation rate in the Euro areas.  Figure 3: Natural gas prices in Europe, January 2021- end 2024  Figure 4: Crude oil price, January 2020-January 2025 Source: Eurostat Created with Datawrapper Inflation skyrocketed not only in the EU member countries, including Eastern European countries, but also in Russia and Ukraine.  Figure 5: Inflation rate in Russia, 2021-2025 As Figure 5 shows, inflation rate in Russia averaged 8.16 % from 2003 until 2025, but it reached an all time high of 20.37 % in April of 2022 just after the Russian invasion of Ukraine. In 2022, Russia experienced high inflation, with the average annual rate reaching approximately 13.75%. This surge in inflation was largely attributed to the economic impact of Western sanctions and increased government spending related to the war in Ukraine. From end of 2022 and throughout 2023, however, inflation was brought under control, but in 2024 inflation started to climb again. The inflation rate in Russia has been moderately high in 2024 and 2025, reaching to 9.5% in 2024 and 9.9% in May 2025 and 9.4% in June 2025.   Figure 6: Inflation rate in Ukraine, 2021-2025 The Ukrainian economy has undergone harsh conditions with the onset of Russia’s full-scale invasion of Ukraine in 2022. Following the start of the invasion, inflation skyrocketed to 26.6% in October 2022 from 10.0% in 2021. Inflation in Ukraine started to slow down from the end of 2022 throughout 2023, reaching 5.1% in November 2023. However, inflation began to rise from early 2024 and then grew to 12% in December 2024. As Figure 5 & 6 shows, inflation rates in Russia and Ukraine do not follow the pattern of EU countries in which inflation skyrocketed in 2022 and then has slowly declined over time. Rather inflation in Russia and Ukraine skyrocketed in 2022 and then slowed down in 2023 and started to climb again in 2024 and 2025. As Figure 7 shows, inflation in Eastern European countries has been also very high just after Russia invaded Ukraine. Hungary’s annual inflation rate surged in 2022, reaching a peak of 26.2 % in January 2023. By mid-2023, it began to decline, and by 2024, it showed a gradual decline trend, reaching 3.7 % in 2024. And inflation in Hungary slightly increased in 2025, reaching 4.6% in June 2025 and 4.4% in May 2025.  The Czech Republic(Czechia) experienced a significant surge in inflation in 2022, with the average inflation rate reaching 15.1%. This marked the second-highest inflation rate since the Czech Republic’s independence in 1993.  Two factors mainly contributed to this surge: High energy prices:The global energy crisis, exacerbated by the war in Ukraine, significantly impacted energy prices in the Czech Republic.  Increased food prices: The rising energy costs also led to higher food prices, with some sectors experiencing inflation rates as high as 26%.  The inflation rate in the Czech Republic in 2023 was relatively high, reaching 10.7%. However, inflation significantly declined in 2024 and 2025. The average annual inflation rate in the Czech Republic for 2024 was 2.4%. The inflation rate in 2025 was also low, recording 2.7% in July 2025. Poland also experienced a significant increase in inflation in 2022, with the average inflation rate reaching 14.2%. The inflation was down to 11.47% in 2023, but it was still high. The rate continued to fall, reaching 3.72% in 2024. In July 2025, inflation dropped to 3.1%. Similarly, Bulgaria experienced a significant surge in inflation in 2022, reaching a peak of 18.7 % in September 2022. However, Bulgaria’s annual inflation rate continued to decline from 13.02% in 2022 to 8.6% in 2023 and 2.6% in 2024. The inflation in June 2025 was 3.1%.  Romania experienced a significant surge in inflation in 2022, reaching a peak of 14.6 in November 2022. However, the annual inflation rate in Romania declined from 13.8% in 2022, recording 10.4% in 2023 and 5.58% in 2024. The inflation rate reached a more moderate rate of 5.8% in June 2025.  Slovakia experienced a significant surge in inflation in 2022, reaching a peak of 15.4 % in November 2022. However, the annual inflation rate in Slovakia declined to 10.96% in 2023, and 3.15% in 2024. The inflation rate in Slovakia reached a more moderate rate of 4.3% in June 2025.  Slovenia had much lower inflation rate than other Eastern European countries. The annual inflation rate in Slovenia was 8.83% in 2022, 7.45% in 2023, and 1.97% in 2024. The inflation rate in Slovenia reached a relatively low rate of 2.2% in June 2025.  Unlike Russia and Ukraine, these Eastern European countries followed the pattern of EU countries in which inflation skyrocketed in 2022 and then has slowly declined over time.   Figure 7: Inflation rate in Eastern Europe during the Ukraine war Very high inflation in Europe during the early stage of Ukraine war basically resulted from energy price increase as Figures 2, 3, and 4 show. It is because European countries were heavily dependent on Russian energy. Figure 8 shows that a number of Eastern European countries were significantly dependent on Russian energy in 2020 before the Ukraine war. For example, Slovakia and Hungary depended on Russia for more than 50 % of their energy use. Moreover, Europe was the largest importer of natural gas in the world. Russia provided roughly 40% and 25% of EU’s imported gas and oil before the Russian invasion of Ukraine. As Figure 9 shows, major gas importers from Russia in 2021 were European countries.  Figure 8: EU member country’s dependence on Russia energy  Figure 9: Major EU importers from Russian Gas in 2021. However, since the Russian invasion of Ukraine in 2022, more than 9,119 new economic sanctions have been imposed on Russia, making it the most sanctioned country in the world. At least 46 countries or territories, including all 27 EU nations, have imposed sanctions on Russia. EU trade with Russia has been strongly affected by the sanctions, resulting in a 58% decline in exports to Russia and an 86% drop in imports from Russia between the first quarter of 2022 and the third quarter of 2024. In the response, as Figure 10 shows, Russia cut its gas exports to the EU by around 80% since the Russian invasion, resulting in higher gas price in Europe.  Figure 10: Monthly Russia-EU pipeline gas flows, 2022-2025 Nonetheless, Figure 11 show that Hungary, Slovakia, and Czech Republic have been major  importers of Russian gas and oil after Russia’s invasion of Ukraine, while Figure 12 shows that Hungary, Bulgaria, Slovenia, Slovakia, and Czech Republic have been major importers and consumers of Russian gas after the Ukraine war. Figure 11: Largest importers of Russian fossil fuels (January 1, 2023 to February 16, 2025)  Figure 12: Selected European countries’ imports of Russian natural gas as shares of total consumption. As energy prices in Europe skyrocketed, inflation, including food price also skyrocketed in Europe. As a result, consumption in Europe was down and GDP growth declined in Europe after the Russian invasion of Ukraine. As Ozili claimed, lower growth rate was also a perceived negative consequence of the Russian invasion of Ukraine. As Figure 13 shows, GDP in EU was down to 3.5 % in 2022 compared to 6.3% in 2021, and it was further down to 0.8 % in 2023 because of economic stagnation and high inflation caused by the Ukraine war.  Figure 13: Average annual GDP growth rate in EU, 1996-2025. Like EU countries, Russia, Ukraine and some Eastern European countries experienced negative growth rates in 2022 & 2023 after Russia’s invasion of Ukraine in February 2022. Russia’s economy has undergone significant transformation since its full-scale invasion of Ukraine in February 2022. As Figure 14 shows, Russia GDP growth rate for 2022 was -2.07%, a 7.68% decline from 2021. This decline in GDP was due to international sanctions, the withdrawal of foreign companies and overall economic uncertainty. However, the impact was largely offset by a favourable terms-of-trade from higher commodity prices and support from third countries – especially China, Turkey, the UAE and countries bordering Russia – which have served as conduits for sanctions evasion.  Figure 14: Russia GDP Growth Rate By 2023, the Russian economy had increasingly shifted to a war footing. As Figure 15 shows, military spending significantly increased after the Russian invasion of Ukraine. Surge in government spending such as military spending, counter-sanctions measures and credit growth boosted investment, construction and overall economic activity in Russia. The military-industrial sector benefitted the most, as did private consumption driven by war-related payments and high real wage growth resulting from the tight labor market. Meanwhile, sectors reliant on Western markets or foreign companies continued to struggle. As a result, Russia’s GDP grew by 3.6 percent in 2023 and 4.3 percent in 2024. Economic expansion resulted from rising government expenditure and investment in its military as it continues its war against Ukraine.  Figure 15: Russia military spending By the end of 2024 and in early 2025, however, signs of economic stagnation had become evident. Even the military-industrial sector began to stagnate. The economy had butted up against its supply-side constraints. In the first quarter of 2025, annual growth slowed to an estimated 1.4 % (from 4.5 % in the last quarter of 2024. Economic contraction was driven by falling activity in trade, mining, real estate and leisure, which growth in agriculture, manufacturing and public administration were not able to offset.  Figure 16: Ukraine GDP growth rate Russian invasion of Ukraine in February 2022 significantly affected Ukraine economy. As Figure 16 shows, Ukraine’s GDP growth rate for 2022 was -28.76%, a 32.08% decline from 2021. GDP growth rate in Ukraine averaged 1.33% from 2000 until 2025, reaching a record low of -36.60 % in the second quarter of 2022. Ukraine’s economy started to bounce back in 2023 and the GDP growth rate in Ukraine for 2023 was 5.32 %, a 34.08 increase in 2022. GDP growth rate reached an all time high of 19.30% in the second quarter of 2023. The GDP growth for 2024 was down to 2.9%. In the first quarter of 2025, Ukraine’s GDP grew 0.9%. However, the Ukrainian economy has been propped up by financial support from Western countries, including military and humanitarian aid, as well as loans from frozen Russian assets. Financing from abroad has been essential in sustaining Ukraine’s ability to survive. Ukraine’s 2024 public sector deficit rose to a record 1.832 trillion hryvnia, or almost 24 % of GDP. Over 60 % of spending went to defense and domestic security. Ukraine’s foreign partner countries provided approximately $42 billion in direct budget support in 2024, of which a large chunk ($17.5 billion) was provided via the EU’s Ukraine Facility. In 2025, Ukraine’s financing situation looks brighter compared to the beginning of 2024, when the EU’s 50-billion-euro Ukraine Facility and America’s over-60-million-dollar Ukraine aid package were blocked due to legislative intransigence. The structure of 2025 deficit financing in Ukraine represents a big change from 2024 as a substantial part of the deficit will be covered out of the yield on Russia’s frozen assets. Last summer, G-7 leaders agreed on an Extraordinary Revenue Acceleration (ERA) arrangement allowing for the use of 183 billion Euro of frozen Russian assets (end-2024) in the EU area to help Ukraine. The ERA program does not draw on the Russian assets directly but uses its proceeds to finance payments and costs of a $50 billion loan. As Figure 17 shows, ERA disbursements allocated to Ukraine will come to nearly $22 billion in 2025 and $11 billion in 2026. The new Trump administration has yet to withdraw from the ERA program, even if substantial cuts have already been made in e.g. USAID financing to Ukraine. The US remains the ERA program’s largest supporter, accounting for a total disbursement commitment of $20 billion. Figure 17: ERA program for Ukraine from Western countries, 2023-2026 Moreover, according to the Ukraine Support Tracker from Kiel University, Ukraine has received 267 billion euros in aid over the past three years. Half of this has been in weapons and military assistance, with 118 billion euros in financial support and 19 billion euros for humanitarian aid. European countries contributed more than the US: 62 billion euros in arms and 70 billion euros in other aid from Europe, compared with 64 billion euros in arms and 50 billion euros in other aid from the US. On the other hand, the Ukraine war caused a massive refugee crisis to Eastern European countries. The Ukraine war made millions of Ukraine people cross the border into neighboring countries in Eastern countries, affecting the economy of each nation. Table 1 shows the number of Ukraine refugees settled in Europe. Most of the Ukraine refugees settled in Poland and the Czech Republic, followed by Romania, Slovakia, and Moldova. These Ukraine refugees had significant impacts on Eastern European economy, in particular on Poland and Czech Republic. Table 1: Number of refugees from Ukraine settled in EuropeSource: UNHCR Operational Data The Ukraine war affected Poland’s economy in several ways, creating both difficulties and opportunities. First, there were problems with energy supplies that could threaten Poland’s access to power. The conflict in Ukraine has shaken up Poland’s energy market quite a bit, affecting its gas and oil supplies and leading to a spike in prices. Right after the conflict began, gasoline prices in Poland jumped by more than 40% as Figure 18 shows. This is mainly because Poland used to get a lot of its energy from Russia, and now, because of the Ukraine war and the sanctions that followed, there’s been a big disruption. As Figure 19 shows, food prices also skyrocketed just after the Ukraine war.  Figure 18: Gasoline price in Poland Figure 19: Food inflation in Poland Food inflation in Poland averaged 4.11 % from 1999 until 2025, reaching an all time high of 24.00 % in February of 2023. Moreover, there has been the arrival of more than 1 million Ukraine refugees, which put pressure on jobs and public services in Poland. The Polish government has had to increase its public spending significantly to provide housing, healthcare, and social services for the newcomers. This sudden increase in spending seemed overwhelming at first, but it also brought potential economic benefits in the long run. For example, the influx of Ukraine refugees boosted demand for local goods and services, which in turn stimulated the Polish economy. Despite both difficulties and opportunities that the Ukraine war brought to Poland, Poland’s GDP growth rate in 2022 was 5.3%. This indicates a strong economic performance, although it was slightly lower than the 6.9% growth rate in 2021. However, Poland's GDP growth rate in 2023 was down to 0.2%. This signifies a significant slowdown compared to the 5.3% growth in 2022. The slowdown was attributed to factors like energy inflation-induced decline in household spending and stagnant consumption. Poland’s real GDP grew by 2.9% in 2024, exceeding initial expectations, which were set at 2.8%. As inflation was down, it allowed for consumer spending and contributed to economic expansion. The Polish economy continues to grow by 3.2% in the first quarter of 2025. Figure 20: annual GDP growth rate in Poland, 2016-2024 The Czech economy has experienced significant impacts from the Ukraine war due to supply chain disruptions and rising energy & food prices. As Figure 21 and 22 show, gasoline and food prices in Czech Republic skyrocketed just after the Russian invasion of Ukraine. Gasoline prices in Czech Republic skyrocketed in June 2022 at 2.05 USD/Liter from 1.12 USD/Liter in May2020. Gasoline prices in Czech Republic averaged 1.48 USD/Liter from 1995 until 2025, reaching a high of 2.05 USD/Liter in June of 2022 and a record low of 0.72 USD/Liter in December of 1998. Figure 21: Gasoline price in the Czech Republic  Figure 22: Food inflation in the Czech Republic As a result, after a solid recovery from Covid-19 pandemic in 2021 with 4.0% growth rate, economic activity slowed down in 2022-2023 as a result of the consequences of the war in Ukraine, including EU sanctions on Russia and rising energy & food prices. Nonetheless, the Czech achieved a moderate growth in 2022 with a growth rate of 2.8% but the Czech economy contracted by -0.1% in 2023 and has been weak with a growth rate of 1.1% in 2024 and 0.7 % in the first quarter of 2025. Figure 23: annual GDP growth rate in Czech Republic, 2016-2024 Hungary’s economy has faced significant challenges due to the war in Ukraine, including increased energy costs, inflation, and disruptions to trade and supply chains. Hungary economy grew by 4.6 % in 2022, but declined to -0.91% in 2023 due to the extremely high inflation and weak consumptions. The consumer price in Hungary rose to a peak of 25.7% in January 2023, the highest rate in the EU. High inflation was driven by surging energy and food prices as Figures 24 and 25 show. The Hungary economy has been weak with the growth rate of 0.5 % in 2024. The GDP expanded by 0.1% in the second quarter of 2025. Figure 24: Gasoline price in Hungary Figure 25: Food inflation in Hungary  Figure 26: annual GDP growth rate in Hungary, 2016-2024 Bulgaria’s economy has faced challenges from the Ukraine ware, due to increased energy prices and disruptions in trade. As Figure 27 shows, the initial economic recovery was stronger than anticipated, with a 4.0% GDP growth in 2022, but the Ukraine war’s impact, coupled with inflation and global economic headwinds, led to a slowdown. Bulgaria’s economy expanded by 1.89 % in 2023. Then Bulgaria GDP bounced back to 2.8 % in 2024 and by 3.1% in the first quarter of 2025. Figure 27: annual GDP growth rate in Bulgaria, 2016-2024 Romania’s economy has experienced both positive and negative impacts from the Ukraine war. As Figure 28 shows, the Romanian economy displayed unexpected strength in 2022, with a 4.8% growth rate thanks to strong private consumption and investment. However, the Ukraine war’s effects, particularly on energy prices and supply chains, dampened Romanian growth. Romanian growth rate for 2023 was 2.2%, but it moderately rebound in 2024 with a 2.8% growth rate. The Romanian GDP increased by 0.3% in the first quarter of 2025. Romania faced challenges related to fiscal deficits, public debt, and inflation. Romania’s ability to navigate these challenges and capitalize on opportunities, such as EU support and its strategic geographic location, will be crucial for its long-term economic prosperity.  Figure 28: annual GDP growth rate in Romania, 2016-2024 Slovakia’s economy has faced significant challenges due to the war in Ukraine, mainly through energy & food price shocks and disruptions to trade and supply chains. As Figure 29 and 30 show, gasoline and food price in Slovakia significantly increased. Slovakia’s economy grew by 0.45% in 2022, a 5.28% decline from 2021. GDP growth rate for 2023 was 1.38 %. GDP growth in Slovakia moderately bounced back in 2024 with a growth rate of 2.0. In the first quarter of 2025, Slovakia economy grew by 0.2 %.  Figure 29: Gasoline price in Slovakia Figure 30: food inflation in Slovakia Figure 31: annual GDP growth rate in Slovakia, 2016-2024 In 2022, Slovenia experienced a slow economic growth with 2.7%, a 5.69% decline from 2021. due to the Ukraine war and subsequent energy price hikes and supply chain disruptions. Slovenia’s economy has been hurt by the Ukraine war and subsequent flooding in 2023 and 2024 with a 2.1 % and 1.5 % growth rate, respectively. Slovenia’s GDP growth was down to -0.7 % in the first quarter of 2025.   Figure 32: annual GDP growth rate in Slovenia, 2016-2024 III. Conclusion  This paper analyzed the economic effects of the Ukraine war on Russia, Ukraine, and Eastern European countries with a focus on inflation and GDP growth. The paper showed that after the Russian invasion of Ukraine in February 2022, inflation skyrocketed not only in the EU member countries, including Eastern European countries, but also in Russia and Ukraine. However, the pattern of inflation was different. Inflation in Russia and Ukraine did not follow the inflation pattern of EU member countries in which inflation skyrocketed in 2022 and then has slowly declined over time. Rather inflation in Russia and Ukraine skyrocketed in 2022 and then slowed down in 2023 and started to climb again in 2024 and 2025. Inflation in Eastern European countries followed the pattern of EU member countries in which inflation skyrocketed in 2022 and has then slowly declined over time. On the other hand, the pattern of GDP growth was different, depending on the individual conditions of each nation, although most countries experienced economic decline in 2022 relative to 2021. Some countries such as Ukraine and Russia experienced negative growth in 2022 and then recovered from 2023. Other countries such as Hungary, Romania, Bulgaria, and Czech Republic experienced moderate growth in 2022 and then slowed down over time. Still other countries like Slovakia and Slovenia experienced very low GDP growth over the period of 2022-2025.  References Biddle, Stephen D. 2022. “Ukraine and the Future of Offensive Maneuver.” War on the Rocks. November 22. https://warontherocks.com/2022/11/ukraine-and-the-future-of-offensive-maneuver/.Biddle, Stephen D. 2023. “Back in the Trenches: Why New Technology Hasn’t Revolutionized Warfare in Ukraine.” Foreign Affairs 102 (5): 153–164.Dijkstra, Hyllke, Myriam Dunn Cavelty, Nicole Jenne, and Yf Reykers. 2023. “What We GotWrong: The War Against Ukraine and Security Studies.” Contemporary Security Policy 44(4): 494–496. https://doi.org/10.1080/13523260.2023.2261298Ozili, P.K., 2022, Global Economic Consequence of Russian Invasion of Ukraine. Available online at: https://ssrn.com/abstract=4064770(open in a new window)

Energy & Economics
Global business connection concept. Double exposure world map on capital financial city and trading graph background. Elements of this image furnished by NASA

Liaison countries as foreign trade bridge builders in the geo-economic turnaround

by Eva Willer

Introduction Geopolitical tensions are making global trade increasingly difficult. In order to reduce the associated risk of default, companies are shifting their trade relations to trading partners that are politically similar to them. In the course of the beginnings of geo-economic fragmentation, politically and economically like-minded countries are also gaining in importance for German and European decision-makers. Liaison countries1 in particular can form a counterforce to the trend towards polarization in foreign trade - especially between the USA and China: they are characterized by a pronounced economic and trade policy openness that overrides differences between geopolitical or ideological camps. Consequently, the question arises: How can relevant connecting countries for Germany and Europe be identified? What opportunities and risks do closer trade relations with these countries offer in order to strengthen foreign trade resilience in geopolitically uncertain times?  With a high degree of openness - defined as the sum of imports and exports in relation to gross domestic product - of over 80 percent2 , the German economy is strongly integrated into global trade. Accordingly, the disruptive effect of geo-economic fragmentation on the German economy would be above average. The defensive strategy to strengthen Germany's economic security by pushing for trade policy independence would only reinforce geo-economic fragmentation. Against the backdrop of comparatively high economic vulnerability, it is necessary to focus on those potential partner countries with which German and European foreign trade could be developed and expanded even under the condition of increasing fragmentation.  Geoeconomic Fragmentation  The term "geo-economic fragmentation" is used to describe the politically motivated reorganization of global goods and financial flows, in which strategic, economic and political interests primarily determine the choice of countries of origin and destination for trade flows.3 In the scenario of geo-economic fragmentation, the result would be the formation of a bloc within the global community of states, which would fundamentally change the regulatory structure of global economic networking. In this case, trade and investment would probably concentrate from a previously diverse range of economic partner countries - prior to the formation of the bloc - on those countries that now - since the formation of the bloc - belong to the same bloc.  The likelihood of this scenario occurring and leading to an increased fragmentation of the global economic order has increased again in the recent past. For example, Donald Trump's second term as US president is causing increasing geopolitical uncertainty worldwide.  Statements on the concrete form of a possible demarcation of potential blocs are subject to a great deal of uncertainty. However, the division of a large part of the global economy into a "US bloc" and a "China bloc" is a conceivable scenario for which German politics and business should prepare.  Data already shows that, at a global level, foreign trade openness has decreased in the recent past. Data from the World Trade Organization (WTO) illustrates the increasing hurdles in global trade in goods. While 3.1% of global imports were still affected by tariff or non-tariff barriers to trade in 2016 - including under WTO rules - this figure rose to 11.8% in 2024 over the following years.4 This development goes hand in hand with a noticeable loss of importance and enforcement of the WTO since the 2010s, which previously played a central role as the guardian of the rules-based global economic order.  Studies by the International Monetary Fund (IMF) have already found indications of an incipient geo-economic fragmentation along potential bloc borders. It shows that trade in goods and foreign direct investment between countries that would belong to the opposing camp in the event of a bloc formation declined on average in 2022 and 2023 - in contrast to foreign trade between countries that are geopolitically close.5  In this initial phase of geo-economic fragmentation, liaison countries are beginning to establish themselves as a counterforce, holding the fragmenting global community of states together with new trade and investment routes.  Identification of liaison countries Specifically, liaison countries have the following characteristics: a pronounced openness to foreign trade in the form of a high foreign trade quota and low tariff and non-tariff trade barriers, as well as pronounced economic relations with partner countries from different geopolitical camps. The geopolitical orientation of countries can be examined using data on voting behavior within the United Nations.6 This involves analyzing whether a country can be assigned to the US or Chinese camp - or whether there is no pronounced proximity and therefore political neutrality or "non-alignment" in the sense of ideological independence. The data-based identification of connecting countries is relatively new. Empirical analyses are also limited to connecting countries in the context of US-Chinese foreign trade - specifically US imports from China. In this case, the characteristics of a connecting country can be broken down into (1) "non-alignment" - i.e. a geopolitical distance to both a Western and an Eastern bloc - as well as (2) an increase in imports and foreign investment from China and (3) a simultaneous increase in exports to the United States. In a narrower sense, this is an evasive reaction to trade restrictions, i.e. circumventing trade. If the foreign trade indicators - specifically the trade and investment data relating to the US and China - of "non-aligned" countries for the period from 2017 to 2020 show corresponding characteristic-related changes compared to previous years, these can be identified as countries connecting the US and China.  The analysis of trade data shows that the value of direct exports from China to the USA fell during Donald Trump's first term in office. At the same time, both Chinese exports to some of the "non-aligned" countries and exports from these countries to the USA have increased significantly. These countries have presumably stepped in as a link on the export route from China to the US after the previously direct trade flow was interrupted by trade barriers and had to find a new route. Companies producing in China are therefore likely to have sought new, indirect ways to maintain access to the US sales market.  A certain statistical inaccuracy in the foreign trade data makes it difficult to draw a definitive conclusion in this context. It should be noted: No single commodity can be tracked across national borders in trade data collection. Whether the additional goods imported from China actually found their way to the United States can only be assumed approximately. However, if the trade flows are aggregated, a clearer picture emerges and the circumvention trade via selected connecting countries - including Vietnam and Mexico - becomes visible.  Data on foreign direct investment rounds off the analysis.7 "Non-aligned" countries in which an increase in Chinese investment can be seen between 2016 and 2020 in addition to trade flows can be identified as connecting countries. Here, too, available data suggests that the companies concerned either exported their goods to the United States via a stopover or even outsourced parts of their production destined for the US market to connecting countries. Five connecting countries between the US and China Based on the 2017-2020 study period, various connecting countries can be empirically identified that were used to indirectly maintain access to the US market. In terms of foreign trade volume, the economically most important connecting countries include Mexico, Vietnam, Poland, Morocco and Indonesia.8 All five countries are characterized by the fact that both their exports of goods to the US and their imports of goods from China increased significantly between 2017 and 2020. In addition, greenfield investments (foreign direct investment to set up a new production facility) have risen significantly compared to the period before 2017.  However, the five countries show different priorities in their development, which differentiate them in their role as connecting countries between the USA and China. In Vietnam, exports to the USA in particular have risen sharply. China has been the most important procurement market for Vietnamese companies for years. Poland, Mexico and Indonesia are characterized as connecting countries primarily by the significant increase in imports from China. Morocco, in turn, was able to attract more Chinese foreign investment in particular. Greenfield investments have almost tripled here since 2017. However, Poland - a rather surprising candidate for the role of liaison country, as it is intuitively assigned to the US-oriented bloc - is positioned fairly centrally between the US and China according to the analysis of voting behavior within the United Nations9. In addition, Poland qualifies primarily due to the sharp rise in greenfield investments from China, primarily in the expansion of domestic battery production.10  It cannot be concluded from the previous studies on the USA and China whether German companies are also circumventing trade barriers from the USA via the countries identified. As the trade policy conflicts between the US and China differ significantly from those between the EU and China, there has been a lack of comparable empirical data to analyze connecting countries in the EU context. Opportunities and challenges As the German economy is strongly oriented towards foreign trade and is closely networked with both the USA and China, German companies play a particularly exposed role in the area of tension between the USA and China. Increased economic exchange with potential connecting countries would offer German companies an opportunity to mitigate the expected shock of a geopolitical bloc. They could at least maintain international trade to a certain extent and thus secure some of the endangered sales and procurement markets. On the other hand, there are also costs associated with expanding foreign trade relations with potential connecting countries. The greater complexity also increases the risk in the value chains. Companies that position themselves wisely within this trade-off buy themselves valuable time in the event of a shock to reorganize themselves against the backdrop of changed foreign trade conditions.  From the perspective of foreign trade policy, it is also possible to examine the extent to which stronger foreign trade cooperation with (potential) connecting countries could have advantages. The trade-off between resilience and complexity must then be assessed at a macroeconomic level, beyond individual company interests. In order to make it easier for companies to connect to potential connecting countries and to create appropriate framework conditions, German and European policy can build on existing comprehensive strategies at national and European level. Both the China Strategy11 and the National Security Strategy12 focus foreign policy on connecting countries as part of a stronger economic and political risk diversification. There is also a similar framework at European level with the EU's Strategic Compass13 . Following on from this, the German government could create targeted incentives to open up new markets in liaison countries, which would diversify critical supply chains and reduce one-sided dependencies.  At the same time, connecting countries pose a challenge. These can be used to circumvent foreign trade measures such as sanctions if flows of goods can find alternative routes via connecting countries more easily than before.  In order to realize opportunities and overcome challenges, close cooperation between science, politics and companies is required. This first requires the identification of a selection of potential connecting countries through scientifically sound analysis. This creates the basis for the subsequent steps in which European and German policymakers work closely with companies to create attractive framework conditions for trade with potential connecting countries - for example through bilateral trade agreements.  Attractive foreign trade framework conditions can create the necessary incentive to actually expand trade relations with potential connecting countries. Companies need to weigh up individual cases and make forward-looking decisions: To what extent is there a risk of a loss of production triggered by geopolitical conflicts? And how much would the complexity of the value chain increase if more potential connecting countries were included? Ultimately, the actual choice of preferred sales and procurement markets lies with the individual companies. LicenseThis work is licensed under CC BY 4.0 References1. Verbindungsländer werden im Sinne von Connectors verstanden, vgl. Gita Gopinath/Pierre-Olivier Gourinchas/Andrea F Presbitero/Petia Topalova, Changing Global Linkages: A New Cold War?, Washington, D.C.: IMF, April 2024 (IMF Working Paper) <https://www.imf.org/en/Publications/WP/Issues/2024/04/05/Changing-Global-Linkages-A-New-ColdWar-547357/>. 2. Statistisches Bundesamt (Destatis), Außenwirtschaft. 2025, <https://www.destatis.de/DE/Themen/Wirtschaft/Globalisierungsindikatoren/aussenwirtschaft.html#246 078/>.  3. Shekahar Aiyar/Franziska Ohnsorge, Geoeconomic Fragmentation and ‚Connector’ Countries, Online verfügbar unter:  <https://mpra.ub.uni-muenchen.de/121726/1/MPRA_paper_121726.pdf>.4. WTO, WTO Trade Monitoring Report, Genf, November 2024, <https://www.wto.org/english/tratop_e/tpr_e/factsheet_dec24_e.pdf/>. 5. Gita Gopinath/Pierre-Olivier Gourinchas/Andrea F Presbitero/Petia Topalova, Changing Global Linkages: A New Cold War?, Washington, D.C.: IMF, April 2024 (IMF Working Paper) <https://www.imf.org/en/Publications/WP/Issues/2024/04/05/Changing-Global-Linkages-A-New-ColdWar-547357/>.  6. Michael A. Bailey/Anton Strezhnev/Erik Voeten, »Estimating Dynamic State Preferences from United Nations Voting Data«, Journal of Conflict Resolution, 61 (2017) 2, S. 430-456, <https://journals.sagepub.com/doi/10.1177/0022002715595700/>.7. Gita Gopinath/Pierre-Olivier Gourinchas/Andrea F Presbitero/Petia Topalova, Changing Global Linkages: A New Cold War?, Washington, D.C.: IMF, April 2024 (IMF Working Paper) <https://www.imf.org/en/Publications/WP/Issues/2024/04/05/Changing-Global-Linkages-A-New-ColdWar-547357/>. War-547357. 8. Enda Curran/Shawn Donnan/Maeva Cousin, »These Five Countries are Key Economic ‚Connectors‘ in a Fragmenting World«, in Bloomberg (online), 1.11.2023, <https://www.bloomberg.com/news/articles/2023-1102/vietnam-poland-mexico-morocco-benefit-from-us-china-tensions/>.9. Michael A. Bailey/Anton Strezhnev/Erik Voeten, »Estimating Dynamic State Preferences from United Nations Voting Data«, Journal of Conflict Resolution, 61 (2017) 2, S. 430-456, <https://journals.sagepub.com/doi/10.1177/0022002715595700/>.  10. Enda Curran/Shawn Donnan/Maeva Cousin, »These Five Countries are Key Economic ‚Connectors‘ in a Fragmenting World«, in Bloomberg (online), 1.11.2023, <https://www.bloomberg.com/news/articles/202311-02/vietnam-poland-mexico-morocco-benefit-from-us-china-tensions/>.11. Auswärtiges Amt, China‐Strategie der Bundesregierung, Berlin, Juli 2023, <https://www.auswaertigesamt.de/resource/blob/2608578/810fdade376b1467f20bdb697b2acd58/china-strategie-data.pdf/>.  12. Auswärtiges Amt, Integrierte Sicherheit für Deutschland: Nationale Sicherheitsstrategie, Berlin, Juni 2023, <https://www.bmvg.de/resource/blob/5636374/38287252c5442b786ac5d0036ebb237b/nationalesicherheitsstrategie-data.pdf/>.  13. Rat der Europäischen Union, Ein Strategischer Kompass für Sicherheit und Verteidigung, Brüssel, März 2022, <https://data.consilium.europa.eu/doc/document/ST-7371-2022-INIT/de/pdf/>.

Energy & Economics
A dedollarisation concept with the BRICS on top of a pile of US dollar bills.

BRICS and De-Dollarization as a Geopolitical Industrial Policy: Implications for Cuba, Venezuela, and Argentina

by Alberto Maresca

ABSTRACT  This paper examines de-dollarization as a geopolitical industrial policy within the BRICS framework and its implications for Cuba, Venezuela, and Argentina. De-dollarization, a process aimed at reducing reliance on the US dollar, has gained momentum among BRICS nations as a response to economic sanctions, monetary sovereignty concerns, and external financial shocks, particularly following the 2008 global financial crisis. For Cuba and Venezuela, de-dollarization is necessary due to US sanctions, pushing them toward alternative  financial  mechanisms  through  BRICS  partnerships. Cuba’s  possible  de-dollarization  follows  increased ties with Russia, China, and Iran. Regarding Venezuela, despite its partial dollarization, Caracas seeks  to  strengthen  non-dollar  transactions  through  oil  trade. In  contrast,  under  President  Javier  Milei,  Argentina  has  rejected  BRICS  and  continues  to  debate  dollarization,  reflecting  the  country’s  historical  and economic ties to the US dollar. The study highlights that de-dollarization is a State-led, multilateral process influenced by external economic conditions and geopolitical alignments. While Cuba and Venezuela actively integrate with BRICS to reduce dollar dependence, Argentina’s approach remains uncertain, shaped by ideological and financial considerations. Keywords: De-dollarization, BRICS, Cuba, Venezuela, Argentina INTRODUCTION De-dollarization is almost a synonym of BRICS. The reduction  of  US  dollar  dominance  and  the  consequential dependence on it represent critical stakes for BRICS countries. Nonetheless, there are nuances and differences amongst BRICS members on monetary policies. Since the first summits (2009–2010), BRICS  asserted  the  Global  South’s  need  to  prioritize  trade  in  domestic  currency  and  refrain  from  US  dollar  pegging. For  initial  members  like  China  and  Russia,  as  well  as  newly  associated  countries  such  as  Iran  and  Cuba,  Western  sanctions  are  the  main  driver  for  de-dollarization. Instead,  for  Brazil,  India, and the majority of most recent BRICS partners  (primarily  from  Africa  and  Southeast  Asia),  de-dollarization  means  enhancing  their  monetary sovereignty,  fostering  domestic  currencies’  value,  and  avoiding  depending  on  US  institutions:  Treasury and Federal Reserve. De-dollarization pertains to  monetary  and  public  policies. Therefore,  it  is  a  state-led process. For this reason, it might be considered an industrial policy. It is necessary to outline that this article adopts the term geopolitical industrial  policy  for  a  State-led  economic  strategy  that,  unlike  inward-oriented  monetary  or  financial  policies, is deeply intertwined with the outward-looking dimension of foreign policy. Hence,  this  work  examines  de-dollarization  as  a  geopolitical  industrial  policy  within  the  BRICS  framework  and  its  implications  for  Cuba,  Venezuela,  and  Argentina. De-dollarization,  a  process  aimed  at  reducing  reliance  on  the  US  dollar,  has  gained momentum  among  BRICS  nations  as  a  response  to economic sanctions, monetary sovereignty concerns,  and  external  financial  shocks,  particularly  following the 2008 global financial crisis. For Cuba and  Venezuela,  de-dollarization  is  necessary  due  to  US  sanctions,  pushing  them  toward  alternative  financial  mechanisms  through  BRICS  partnerships. Cuba’s  possible  de-dollarization  follows  increased  ties  with  Russia,  China,  and  Iran. Regarding  Venezuela, despite its partial dollarization, Caracas seeks to  strengthen  non-dollar  transactions  through  oil  trade. In  contrast,  under  President  Javier  Milei,  Argentina has rejected BRICS and continues to debate dollarization, reflecting the country’s historical and economic ties to the US dollar. The study highlights that de-dollarization is a State-led, multilateral process  influenced  by  external  economic  conditions  and geopolitical alignments. While Cuba and Venezuela actively integrate with BRICS to reduce dollar dependence,  Argentina’s  approach  remains  uncertain,  shaped  by  ideological  and  financial  considerations. It is undebatable that there are differences between usual industrial policies and de-dollarization. Indus-trial policies look inward, are fashioned upon domes-tic  matters,  and  contradict, court,  multilateral  efforts. De-dollarization  is  a  geopolitical  industrial  policy that looks outward, focusing on the role of a given country in the world economy. Without multilateralism, a State pursuing de-dollarization would quickly become a pariah. As a geopolitical industrial policy,  de-dollarization  owes  its  rationale  to  external  shocks. It  is  safe  to  define  de-dollarization  as  exogenously  motivated. The  2008  global  financial  crisis (GFC) represented the critical external shock for  BRICS  members  to  escalate  their  de-dollarization objectives: “[E]specially  since  the  2008  global  financial  crisis,  central banks of many countries have been trying to diversify their portfolios to shift away from the US dollar through liquidating holdings of US Treasuries and increasing other assets including the euro, yen, renminbi and gold.” (Li, 2023, p. 9).  The 21st century wrought incentives to de-dollarization that finally sparked because of the GFC. However,  the  mainstream  doubts  surrounding  de-dollarization involve its feasibility. There are no tools to objectively  measure  the  status  of  de-dollarization  or its future outcomes. Notwithstanding limitations, de-dollarization  is  increasingly  attracting  Global  South economies. Specifically looking at Latin America,  this  work  outlines  how  de-dollarization  becomes  an  obligation  for  sanctioned  countries:  Cuba  and  Venezuela. The  two  ALBA  governments  mingled  with  BRICS  for  a  long  time,1  with  Havana  joining the forum in association and Venezuela almost on the same route, stopped by the Brazilian veto in the  Kazan  summit. Cuban  and  Venezuelan  de-dollarization finds in BRICS a multilateral opportunity.  The third country examined is Argentina since the government  of  Javier  Milei  refused  to  enter  BRICS  and  continuously  flirted  with  dollarizing  the  economy. From President Menem’s pegging to the US dollar (uno a uno) to the 2001 Corralito, Argentina’s recent economic history inevitably rests on currency issues (IMF, 2003). Unlike Venezuela, and on the contrary of Cuba (which is not part of the IMF), Argentina’s economic policies intertwine with Bretton Woods  institutions. That  might  be  the  reason  why  neoliberal Argentinian economists found in dollarization  a  solution  for  Buenos  Aires  (Cachanosky  et  al., 2023).  1. Force Majeure De-Dollarization for Cuba and Venezuela  Since  1999,  when  Fidel  Castro  and  Hugo  Chávez  coincided, de-dollarization meant an industrial foreign policy to antagonize US hegemony. In Cuba, de-dollarization  is  a  more  difficult  process  than  usual  assumptions  and  certainly  more  challenging  than  in  Venezuela. 2004  marked  the  year  when  the  US  dollar  was  officially  prohibited  on  the Caribbean Island, to reverse the dual currency  system  implemented  since  the  Special  Period  (Herrera  &  Nakatani,  2004). The  extra-territoriality  of  US  sanctions,  affecting  in  their  secondary effect  Cuba’s  trade,  led  Havana  to  a  de-dollarization fashioned upon the path that Deligöz (2024) identified  for  China  and  Russia. Besides  realpolitik  and  geopolitical  strategies,  Cuba’s  association  with  BRICS,  occurred  in  October  2024,  is  the  la-test  effort  to  de-dollarize. Venezuela’s  economic  crises and COVID-19 pushed Cuba into continuous indebtedness to survive, with US dollars reallowed but  still  at  limited  provision  due  to  Washington’s  restrictions  (Luis,  2020). To  give  account  of  its  urgencies,  in  a  few  months,  Havana  moved  from  apparent dollarization to initiatives for de-dollarization, thanks to BRICS. Over the summer, Primer Minister Manuel Marrero enabled USD payments in the  tourist  sector  (Gámez  Torres,  2024)  to  tackle  the balance of payments deficit with liquidity. For  a  country  obliged  to  rapidly  change  industrial  policies,  the  BRICS  opportunity  could  not  be  mis-sed. Cuba’s  reliance  on  Russia,  China,  and  Iran  may  materialize   a   complete   de-dollarization   that   can   favor  BRICS  projects  and  escape  US  sanctions. Of  course, the evident permanence of the bloqueo, regardless  of  who  runs  the  White  House,  is  the  main  driver for Cuba’s de-dollarization. A similar but quite nuanced situation applies to Venezuela as well. From the Bolivarian era inaugurated by President Chávez, de-dollarization  entangled  foreign  policy  objectives  even before US sanctions. The Sucre digital currency was  created  by  the  governments  of  Venezuela  and  Ecuador  as  the  main  ALBA  initiative  to  de-dollarize  commercial  transactions  among  Bolivarian  nations  (Benzi et al., 2016). ALBA-promoted Sucre was analogous to BRICS’ favoring of blockchains and digital currencies, limiting the USD to a reference value for the  bloc’s  transactions  (Mayer,  2024). US  sanctions  on Venezuela’s oil production, sparked under the first Trump Administration, meant a significant remotion of USD-denominated transactions for Caracas. Considering  ALBA’s  slow  progress  and  the  infeasibility  of fully adopting the Sucre, President Maduro had to look at BRICS for solutions. Despite  not  having  diplomatic  relations  with  Washington,  Venezuela  is  still  an  IMF  member. Ladasic points  out  that  “[a]s  Venezuela  joined  the  pack  of  countries  trading  oil  outside  of  USD  and  has  instead priced it in Chinese yuan, BRICS together with Venezuela  already  have  16%  needed  for  IMF  veto  power to use in a crisis” (2017, p. 100). The rentier characterization of the Venezuelan economy and its dependency  on  oil  exports  make  de-dollarization  a necessity. As per Cuba, unilateral policies are not enough. Venezuela’s  outcry  merged  with  inflation,  the  devaluation  of  the  bolívar,  and  a  paralysis  of  the  Venezuelan  Central  Bank  (BCV)  that  put  total  dollarization on the industrial-public policies’ table (Briceño  et  al.,  2019). Although  the  country  is  still  under  a  sort  of  de  facto  dollarization,  Venezuela’s  economic  resurrection  should  occur  together  with  a  de-dollarization  strategy. Failure  to  enter  BRICS  in the Kazan summit provides a temporary brake to Venezuela’s  de-dollarization,  but  the  prolific  trade  with China, Russia, Iran, and Türkiye will, in all cases, align Venezuela with BRICS policies. 3. Argentina: De-Dollarizing a Passion Economists  were  surely  interested  in  Javier  Milei’s  dollarization  claims. Less  than  a  year  into  his  government,  dollarization  seems  impossible  to  the  libertarian  president. Milei’s  negative  to  BRICS  demonstrates  that  de-dollarization  is  currently  not  considerable  for  Casa  Rosada. Nevertheless,  it  is  relevant to outline that Argentinian academia questioned  the  role  of  the  USD  and  studied  economic  policies  involving  de-dollarization. Corso  and  Sangiácomo (2023), in affiliation with the Central Bank of  Argentina  (BCRA),  argued  that  de-dollarization  might  help  in  relieving  the  extreme  inflation  saw  under  Alberto  Fernández’s  ruling. Other  authors  implied  that  the  Kirchners’  limitations  on  USD  access would lead to a gradual de-dollarization of the economy,  but  with  constraints  particularly  from  a  USD dominated housing market across Latin America  (Luzzi,  2013). If  under  the  Kirchners,  and  with  support of South American left-leaning geopolitics, de-dollarization  could  really  offer  a  pathway  for  the Argentine economy, with Milei that is barely an option. The  Argentine  relation  with  the  USD  does not hold a clear ideological cleavage. Argentinians’ passion for the dollar, as stressed by Bercovich and Rebossio (2013), embraced diverse political figures such as Perón, Aníbal Fernández (a prominent Kirchnerist politician), and Martínez de Hoz. The peso’s continuous  instability  legitimized  the  widespread  informal adoption of the USD, with first insight fore-seeable in the currency devaluation subsequent to the Great Depression (Díaz Alejandro, 1970). There is also a nationalistic meaning behind the peso, whose  national  heroes  imprinted,  from  Belgrano  to  Evita (Moreno Barreneche, 2023), portray a sentimental attachment to the banknotes that Argentinians do not want to erase. In sum, Argentina’s de-dollarization is as difficult as dollarization. Milei’s obsession for US hegemony inserts de-dollarization in a faraway scenario. Moreover,  Donald  Trump’s  victory,  who  promised  high tariffs to countries that unpeg from the USD (Butts,  2024),  constitutes  a  natural  barrier  to  de-dollarization. Its political viability might depend on an eventual Peronist succession to Milei. Argentina’s financial closeness  to  China,  and  a  possible  resume  of  BRICS  talks,  could  indicate  de-dollarization  as  a  future  last  resort. In this sense, de-dollarization within the BRICS framework might help Argentina in solving structural issues: Chronic external debt and dependency on Bretton Woods institutions. CONCLUSIONS De-dollarization is State-led and can be considered a  geopolitical  industrial  policy. Cuba,  Venezuela,  and  Argentina  show  that  de-dollarization  depends  on  geopolitical  calculus  and  economic  considerations. The incentives may be different, ranging from US sanctions to devaluation of the national currency. However,  unlike  dollarization,  de-dollarization  cannot  be  pursued  unilaterally. The  rise  of  BRICS  motivates  Global  South  countries  to  de-dollarize  under its guarantees. For Cuba and Venezuela, the association  with  BRICS  and  the  interdependence  with other sanctioned economies like Russia, China, and Iran, make de-dollarization an opportunity. Argentina’s  relation  with  the  USD  follows  its  turbulent  economic  history. Simultaneously,  there  is  passion  for  dollars and nationalism toward the peso banknotes. In this  context,  even  Milei  showed  that  dollarization  is  in  no way easier that de-dollarization. The currency issues affecting Argentina might not be resolved by neither of the two policies, but a future BRICS collaboration could bring de-dollarization again into the political debate. NOTES1  ALBA  references  the  Alianza  Bolivariana  para  los  Pueblos  de  Nuestra  América,  a  regional  organization  founded  by  Cuba  and  Venezuela,  including Bolivia, Honduras, Nicaragua, and several Caribbean islands. It was created in 2004 under the auspices of Hugo Chávez.REFERENCESBenzi,  D.,  Guayasamín,  T.,  &  Vergara,  M.  (2016). ¿Hacia  una  Nueva   Arquitectura   Financiera   Regional?   Problemas   y  perspectivas  de  la  cooperación  monetaria  en  el  AL-BA-TCP. Revista Iberoamericana de Estudios de Desarrollo, 5(1), 32–61. https://doi.org/10.26754/ojs_ried/ijds.193. Bercovich, A., & Rebossio, A. (2013). Estoy verde: Dólar, una pasión argentina. Aguilar.Butts, D. (2024, September 9). Trump’s vow of 100% tariffs on nations that snub the dollar is a lose-lose for China and U.S., economist says. CNBC. https://www.cnbc.com/2024/09/09/economist-calls-trumps-threat-to-tariff-countries-that-shun-the-dollar-a-lose-lose.html. Cachanosky, N., Ocampo, E., & Salter, A. W. (2023). Les-sons from Dollarization in Latin America. Free Market Institute  Research  Paper  No.  4318258,  AIER  Sound  Money  Project  Working  Paper  No.  2024-01.  https://doi.org/10.2139/ssrn.4318258. Corso, E. A., & Sangiácomo, M. (2023). Financial De-dollarization in Argentina: When the wind always blows from the East. BCRA Economic Research Working Paper No. 106. https://www.econstor.eu/handle/10419/297801.Deligöz, H. (2024). The Exorbitant Privilege of US Extra-territorial  Sanctions.  İnsan  ve  Toplum,  14(3),  29–52.  https://dergipark.org.tr/en/pub/insanvetoplum/is-sue/86942/1543025. Díaz Alejandro, C. F. (1970). Essays on the Economic His-tory of the Argentine Republic. Yale University Press.Gámez  Torres,  N.  (2024,  July  18).  Cuba  moves  to  ‘partially’  dollarize  economy  as  government  struggles  to  make  payments.  Miami  Herald.  https://www.mia-miherald.com/news/nation-world/world/americas/cuba/article290210784.html. Herrera,  R.,  &  Nakatani,  P.  (2004).  De-Dollarizing  Cuba.  International  Journal  of  Political  Economy,  34(4),  84–95. https://www.jstor.org/stable/40470915. Hurtado  Briceño,  A.  J.,  Zerpa  de  Hurtado,  S.,  &  Mora  Mora,  J.  U.  (2019).  Dollarization  or  Monetary  Independence?  Evidence  from  Venezuela.  Asian  Journal  of  Latin  American  Studies,  32(4),  53–71.  https://doi.org/10.22945/ajlas.2019.32.4.53. IMF. (2003, October 8). Lessons from the Crisis in Argen-tina. Ladasic,  I.  K.  (2017).  De-Dollarization  of  Oil  and  Gas  Trade.  International  Multidisciplinary  Scientific  Geo-Conference,    17,    99–106.    https://doi.org/10.5593/sgem2017H/15. Li,  Y.  (2023).  Trends,  Reasons  and  Prospects  of  De-Dollarization. South Centre Research Paper No. 181. https://www.econstor.eu/handle/10419/278680. Luis, L. R. (2020, October 7). Cuba: Dollar Crunch, Dollarization and Devaluation. Cuba Capacity Building Project. https://horizontecubano.law.columbia.edu/news/cuba-dollar-crunch-dollarization-and-deva-luation. Luzzi,  M.  (2013).  Economía  y  cultura  en  las  interpretaciones sobre los usos del dólar en la Argentina. In  A.  Kaufman  (Ed.),  Cultura  social  del  dólar  (pp.  11–19).  UBA  Sociales.  https://publicaciones.sociales.uba.ar/index.php/socialesendebate/article/view/3319.Mayer,  J.  (2024).  De-Dollarization:  The  Global  Payment  Infrastructure  and  Wholesale  Central  Bank  Digital  Currencies.  FMM  Working  Paper  No.  102.  https://www.econstor.eu/handle/10419/297865. Moreno  Barreneche,  S.  (2023).  El  dinero  como  soporte  material  de  la  disputa  por  el  sentido  de  la  nación:  Estudio  del  peso  argentino  desde  una  perspectiva  semiótica.  Estudios  Sociales:  Revista  Universitaria  Semestral,  64,  1–19.  https://doi.org/10.14409/es.2023.64.e0046. CONFLICT OF INTERESTThe  author  declares  that  there  are  no  conflicts  of  interest related to the article.ACKNOWLEDGMENTS Not applicable.FUNDING Not applicable.PREPRINT Not published.COPYRIGHT Copyright  is  held  by  the  authors,  who  grant  the  Revista  Política  Internacional  the  exclusive  rights  of  first  publication. Authors  may  enter  into  additional agreements for non-exclusive distribution of the  version  of  the  work  published  in  this  journal  (e.g.,  publication  in  an  institutional  repository,  on  a personal website, publication of a translation or as a book chapter), with the acknowledgment that it was first published in this journal. Regarding copyright, the journal does not charge any fee for the submission, processing, or publication of articles.

Energy & Economics
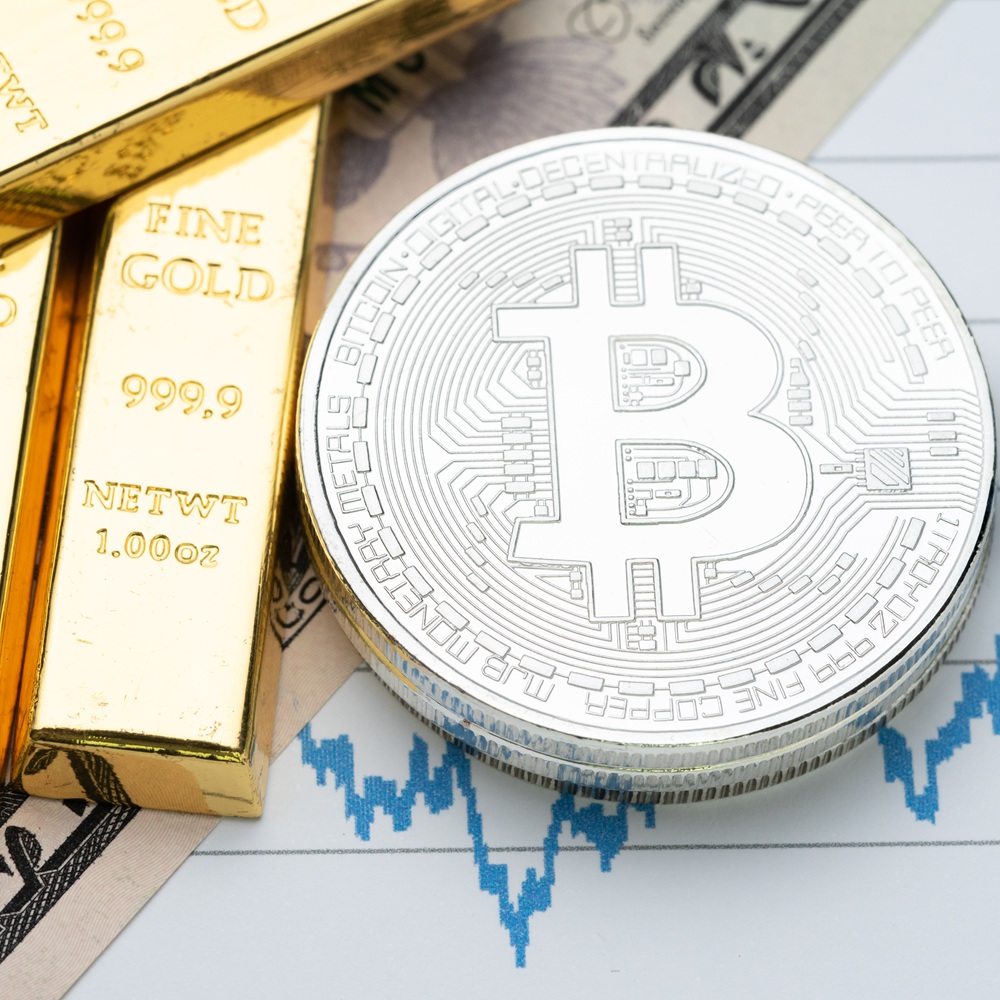
Commodity and alternative asset, gold bar and crypto currency Bitcoin on rising price graph as financial crisis or war safe haven, investment asset or wealth concept.

Assessing Bitcoin and Gold as Safe Havens Amid Global Uncertainties: A Rolling Window DCC-GARCH Analysis

by Anoop S Kumar , Meera Mohan , P. S. Niveditha

Abstract We examine the roles of Gold and Bitcoin as a hedge, a safe haven, and a diversifier against the coronavirus disease 2019 (COVID-19) pandemic and the Ukraine War. Using a rolling window estimation of the dynamic conditional correlation (DCC)-based regression, we present a novel approach to examine the time-varying safe haven, hedge, and diversifier properties of Gold and Bitcoin for equities portfolios. This article uses daily returns of Gold, Bitcoin, S&P500, CAC 40, and NSE 50 from January 3, 2018, to October 15, 2022. Our results show that Gold is a better safe haven than the two, while Bitcoin exhibits weak properties as safe haven. Bitcoin can, however, be used as a diversifier and hedge. This study offers policy suggestions to investors to diversify their holdings during uncertain times. Introduction Financial markets and the diversity of financial products have risen in both volume and value, creating financial risk and establishing the demand for a safe haven for investors. The global financial markets have faced several blows in recent years. From the Global Financial Crisis (GFC) to the outbreak of the pandemic and uncertainty regarding economic policy measures of governments and central banks, the financial markets including equity markets around the world were faced with severe meltdowns. This similar behavior was observed in other markets including equity and commodity markets, resulting in overall uncertainty. In this scenario, the investors normally flock toward the safe-haven assets to protect their investment. In normal situations, investors seek to diversify or hedge their assets to protect their portfolios. However, the financial markets are negatively impacted when there are global uncertainties. Diversification and hedging methods fail to safeguard investors’ portfolios during instability because almost all sectors and assets are negatively affected (Hasan et al., 2021). As a result, investors typically look for safe-haven investments to safeguard their portfolios under extreme conditions (Ceylan, 2022). Baur and Lucey (2010) provide the following definitions of hedge, diversifier, and safe haven: Hedge: An asset that, on average, has no correlation or a negative correlation with another asset or portfolio. On average, a strict hedge has a (strictly) negative correlation with another asset or portfolio.Diversifier: An asset that, on average, has a positive correlation (but not perfect correlation) with another asset or portfolio. Safe haven: This is the asset that in times of market stress or volatility becomes uncorrelated or negatively associated with other assets or a portfolio. As was previously indicated, the significant market turbulence caused by a sharp decline in consumer spending, coupled with insufficient hedging opportunities, was a common feature of all markets during these times (Yousaf et al., 2022). Nakamoto (2008) suggested a remedy by introducing Bitcoin, a “digital currency,” as an alternative to traditional fiduciary currencies (Paule-Vianez et al., 2020). Bitcoin often described as “Digital Gold” has shown greater resilience during periods of crises and has highlighted the potential safe haven and hedging property against uncertainties (Mokni, 2021). According to Dyhrberg (2016), the GFC has eased the emergence of Bitcoin thereby strengthening its popularity. Bouri et al. (2017) in their study indicate that Bitcoin has been viewed as a shelter from global uncertainties caused by conventional banking and economic systems. Recent research has found that Bitcoin is a weak safe haven, particularly in periods of market uncertainty like the coronavirus disease 2019 (COVID-19) crisis (Conlon & McGee, 2020; Nagy & Benedek, 2021; Shahzad et al., 2019; Syuhada et al., 2022). In contrast to these findings, a study by Yan et al. (2022) indicates that it can function as a strong safe haven in favorable economic times and with low-risk aversion. Ustaoglu (2022) also supports the strong safe-haven characteristic of Bitcoin against most emerging stock market indices during the COVID-19 period. Umar et al. (2023) assert that Bitcoin and Gold are not reliable safe-havens. Singh et al. (2024) in their study reveal that Bitcoin is an effective hedge for investments in Nifty-50, Sensex, GBP–INR, and JPY–INR, at the same time a good diversifier for Gold. The study suggests that investors can incorporate Bitcoin in their portfolios as a good hedge against market volatility in equities and commodities markets. During the COVID-19 epidemic, Barbu et al. (2022) investigated if Ethereum and Bitcoin could serve as a short-term safe haven or diversifier against stock indices and bonds. The outcomes are consistent with the research conducted by Snene Manzli et al. (2024). Both act as hybrid roles for stock market returns, diversifiers for sustainable stock market indices, and safe havens for bond markets. Notably, Bhuiyan et al. (2023) found that Bitcoin provides relatively better diversification opportunities than Gold during times of crisis. To reduce risks, Bitcoin has demonstrated a strong potential to operate as a buffer against global uncertainty and may be a useful hedging tool in addition to Gold and similar assets (Baur & Lucey, 2010; Bouri et al., 2017; Capie et al., 2005; Dyhrberg, 2015). According to Huang et al. (2021), its independence from monetary policies and minimal association with conventional financial assets allow it to have a safe-haven quality. Bitcoins have a substantial speed advantage over other assets since they are traded at high and constant frequencies with no days when trading is closed (Selmi et al., 2018). Additionally, it has been demonstrated that the average monthly volatility of Bitcoin is higher than that of Gold or a group of international currencies expressed in US dollars; nevertheless, the lowest monthly volatility of Bitcoin is lower than the maximum monthly volatility of Gold and other foreign currencies (Dwyer, 2015). Leverage effects are also evident in Bitcoin returns, which show lower volatilities in high return periods and higher volatilities in low return times (Bouri et al., 2017; Liu et al., 2017). According to recent research, Bitcoins can be used to hedge S&P 500 stocks, which increases the likelihood that institutional and retail investors will build secure portfolios (Okorie, 2020). Bitcoin demonstrates strong hedging capabilities and can complement Gold in minimizing specific market risks (Baur & Lucey, 2010). Its high-frequency and continuous trading further enrich the range of available hedging tools (Dyhrberg, 2016). Moreover, Bitcoin spot and futures markets exhibit similarities to traditional financial markets. In the post-COVID-19 period, Zhang et al. (2021) found that Bitcoin futures outperform Gold futures.Gold, silver, palladium, and platinum were among the most common precious metals utilized as safe-haven investments. Gold is one such asset that is used extensively (Salisu et al., 2021). Their study tested the safe-haven property of Gold against the downside risk of portfolios during the pandemic. Empirical results have also shown that Gold functions as a safe haven for only 15 trading days, meaning that holding Gold for longer than this period would result in losses to investors. This explains why investors buy Gold on days of negative returns and sell it when market prospects turn positive and volatility decreases (Baur & Lucey, 2010). In their study, Kumar et al. (2023) tried to analyse the trends in volume throughout futures contracts and investigate the connection between open interest, volume, and price for bullion and base metal futures in India. Liu et al. (2016) in their study found that there is no negative association between Gold and the US stock market during times of extremely low or high volatility. Because of this, it is not a strong safe haven for the US stock market (Hood & Malik, 2013). Post-COVID-19, studies have provided mixed evidence on the safe-haven properties of Gold (Bouri et al., 2020; Cheema et al., 2022; Ji et al., 2020). According to Kumar and Padakandla (2022), Gold continuously demonstrates safe-haven qualities for all markets, except the NSE, both in the short and long term. During the COVID-19 episode, Gold’s effectiveness as a hedge and safe-haven instrument has been impacted (Akhtaruzzaman et al., 2021). Al-Nassar (2024) conducted a study on the hedge effectiveness of Gold and found that it is a strong hedge in the long run. Bhattacharjee et al. (2023) in their paper examined the symmetrical and asymmetrical linkage between Gold price levels and the Indian stock market returns by employing linear autoregressive distributed lag and nonlinear autoregressive distributed lag models. The results exhibit that the Indian stock market returns and Gold prices are cointegrated. According to the most recent study by Kaczmarek et al. (2022), Gold has no potential as a safe haven, despite some studies on the COVID-19 pandemic showing contradictory results. The co-movements of Bitcoin and the Chinese stock market have also normalized as a result of this epidemic (Belhassine & Karamti, 2021). Widjaja and Havidz (2023) verified that Gold was a safe haven asset during the COVID-19 pandemic, confirming the Gold’s safe-haven characteristic. As previously pointed out, investors value safe-haven investments in times of risk. Investors panic at these times when asset prices fall and move from less liquid (risky) securities to more liquid (safe) ones, such as cash, Gold, and government bonds. An asset must be bought and sold rapidly, at a known price, and for a reasonably modest cost to be considered truly safe (Smales, 2019). Therefore, we need to properly re-examine the safe-haven qualities of Gold and Bitcoin due to the mixed evidences regarding their safe-haven qualities and the impact of COVID-19 and the war in Ukraine on financial markets. This work contributes to and deviates from the body of existing literature in the following ways. We propose a novel approach in this work to evaluate an asset’s time-varying safe haven, hedge, and diversifier characteristics. This research examines the safe haven, hedging, and diversifying qualities of Gold and Bitcoin against the equity indices; S&P 500, CAC 40, and NSE 50. Through the use of rolling window estimation, we extend the methodology of Ratner and Chiu (2013) by estimating the aforementioned properties of the assets. Comparing rolling window estimation to other conventional techniques, the former will provide a more accurate representation of an asset’s time-varying feature. This study explores the conventional asset Gold’s time-varying safe haven, hedging, and diversifying qualities during crises like the COVID-19 pandemic and the conflict in Ukraine. We use Bitcoin, an unconventional safe-haven asset, for comparison. Data and Methodology We use the daily returns of three major equity indices; S&P500, CAC 40, and NSE 50 from January 3, 2018, to October 15, 2022. The equity indices were selected to represent three large and diverse markets namely the United States, France, and India in terms of geography and economic development. We assess safe-haven assets using the daily returns of Gold and Bitcoin over the same time. Equity data was collected from Yahoo Finance, Bitcoin data from coinmarketcap.com, and Gold data from the World Gold Council website. Engle (2002) developed the DCC (Dynamic Conditional Correlation)-GARCH model, which is frequently used to assess contagion amid pandemic uncertainty or crises. Time-varying variations in the conditional correlation of asset pairings can be captured using the DCC-GARCH model. Through employing this model, we can analyse the dynamic behavior of volatility spillovers. Engle’s (2002) DCC-GARCH model contains two phases; 1. Univariate GARCH model estimation2. Estimation of time-varying conditional correlation. For its explanation, mathematical characteristics, and theoretical development, see here [insert the next link in “the word here” https://journals.sagepub.com/doi/10.1177/09711023251322578] Results and Discussion The outcomes of the parameters under the DCC-GARCH model for each of the asset pairs selected for the investigation are shown in Table 1.   First, we look at the dynamical conditional correlation coefficient, ρ.The rho value is negative and insignificant for NSE 50/Gold, NSE 50 /BTC, S&P500/Gold, and S&P500/BTC indicating a negative and insignificant correlation between these asset pairs, showing Gold and Bitcoin as potential hedges and safe havens. The fact that ρ is negative and significant for CAC 40/Gold suggests that Gold can be a safe haven against CAC 40 swings. The asset pair CAC/BTC, on the other hand, has possible diversifier behavior with ρ being positive but statistically insignificant. Next, we examine the behavior of the DCC-GARCH parameters; α and β. We find that αDCC is statistically insignificant for all the asset pairs, while βDCC is statistically significant for all asset pairs. βDCC quantifies the persistence feature of the correlation and the extent of the impact of volatility spillover in a particular market’s volatility dynamics. A higher βDCC value implies that a major part of the volatility dynamics can be explained by the respective market’s own past volatility. For instance, the NSE 50/Gold’s βDCC value of 0.971 shows that there is a high degree of volatility spillover between these two assets, with about 97% of market volatility being explained by the assets’ own historical values and the remainder coming from spillover. Thus, we see that the volatility spillover is highly persistent (~0.8) for all the asset pairs except NSE 50/BTC. The results above show that the nature of the dynamic correlation between the stock markets, Bitcoin and Gold is largely negative, pointing toward the possibility of Gold and Bitcoin being hedge/safe haven. However, a detailed analysis is needed to confirm the same by employing rolling window analysis, and we present the results in the forthcoming section. We present the rolling window results for S&P500 first. We present the regression results for Gold in Figure 1 and Bitcoin in Figure 2   Figure 1. Rolling Window Regression Results for S&P500 and Gold.Note: Areas shaded under factor 1 represent significant regression coefficients. In Figure 1, we examine the behavior of β0 (intercept term), β1, β2, and β3 (partial correlation coefficients). The intercept term β0 will give an idea about whether the asset is behaving as a diversifier or hedge. Here, the intercept term shows significance most of the time. However, during 2018, the intercept was negative and significant, showing that it could serve as a hedge during geopolitical tensions and volatilities in the global stock market. However, during the early stages of COVID-19, we show that the intercept is negative and showing statistical significance, suggesting that Gold could serve as a hedge during the initial shocks of the pandemic. These findings are contrary to the results in the study by Tarchella et al. (2024) where they found hold as a good diversifier. Later, we find the intercept to be positive and significant, indicating that Gold could act as a potential diversifier. But during the Russia-Ukraine War, Gold exhibited hedge ability again. Looking into the behavior of β1, which is the partial correlation coefficient for the tenth percentile of return distribution shows negative and insignificant during 2018. Later, it was again negative and significant during the initial phases of COVID-19, and then negative in the aftermath, indicating that Gold could act as a weak safe haven during the COVID-19 pandemic. Gold could serve as a strong safe haven for the SP500 against volatility in the markets brought on by the war in Ukraine, as we see the coefficient to be negative and large during this time. From β2 and β3, the partial correlation coefficients of the fifth and first percentile, respectively, show that Gold possesses weak safe haven properties during COVID-19 and strong safe haven behavior during the Ukraine crisis. Next, we examine the characteristics of Bitcoin as a hedge/diversifier/safe haven against the S&P500 returns. We present the results in Figure 2.   Figure 2. Rolling Window Regression Results for S&P500 and Bitcoin.Note: Areas shaded under factor 1 represent significant regression coefficients. Like in the previous case, we begin by analysing the behavior of the intercept coefficient, which is β0. As mentioned earlier the intercept term will give a clear picture of the asset’s hedging and diversifier property. In the period 2018–2019, the intercept term is positive but insignificant. This could be due to the large volatility in Bitcoin price movements during the period. It continues to be minimal (but positive) and insignificant during 2019–2020, indicating toward weak diversification possibility. Post-COVID-19 period, the coefficient shows the significance and positive value, displaying the diversification potential. We see that the coefficient remains positive throughout the analysis, confirming Bitcoin’s potential as a diversifier. Looking into the behavior of β1 (the partial correlation coefficient at tenth percentile), it is positive but insignificant during 2018. The coefficient is having negative sign and showing statistical significance in 2019, suggesting that Bitcoin could be a good safe haven in that year. This year was characterized by a long list of corporate scandals, uncertainties around Brexit, and tensions in global trade. We can observe that throughout the COVID-19 period, the coefficient is showing negative sign and negligible during the March 2020 market meltdown, suggesting inadequate safe-haven qualities. However, Bitcoin will regain its safe-haven property in the coming periods, as the coefficient is negative and significant in the coming months. The coefficient is negative and shows statistical significance during the Ukrainian crisis, suggesting strong safe-haven property. Only during the Ukrainian crisis could Bitcoin serve as a safe haven, according to the behavior of β2, which displays the partial correlation coefficient at the fifth percentile. Bitcoin was a weak safe haven during COVID-19 and the Ukrainian crisis, according to β3, the partial correlation coefficient for the first percentile (coefficient negative and insignificant). According to the overall findings, Gold is a stronger safe haven against the S&P 500’s swings. This result is consistent with the previous studies of Triki and Maatoug (2021), Shakil et al. (2018), Będowska-Sójka and Kliber (2021), Drake (2022), and Ghazali et al. (2020), etc. The same analysis was conducted for the CAC 40 and the NSE 50; the full analysis can be found here [insert the next link in “the word here” https://journals.sagepub.com/doi/10.1177/09711023251322578]. However, it is important to highlight the respective results: In general, we may say that Gold has weak safe-haven properties considering CAC40. We can conclude that Bitcoin’s safe-haven qualities for CAC40 are weak. We can say that Gold showed weak safe-haven characteristics during the Ukraine crisis and good safe-haven characteristics for the NSE50 during COVID-19. We may say that Bitcoin exhibits weak safe haven, but strong hedging abilities to NSE50. Concluding Remarks In this study, we suggested a new method to evaluate an asset’s time-varying hedge, diversifier, and safe-haven characteristics. We propose a rolling window estimation of the DCC-based regression of Ratner and Chiu (2013). Based on this, we estimate the conventional asset’s time-varying safe haven, hedging, and diversifying properties during crises like the COVID-19 pandemic and the conflict in Ukraine. For comparison purposes, we include Bitcoin, a nonconventional safe-haven asset. We evaluate Gold and Bitcoin’s safe haven, hedging, and diversifier properties to the S&P 500, CAC 40, and NSE 50 variations. We use a rolling window of length 60 to estimate the regression. From the results, we find that Gold can be considered as a better safe haven against the fluctuations of the S&P 500. In the case of CAC 40, Gold and Bitcoin have weak safe-haven properties. While Bitcoin demonstrated strong safe-haven characteristics during the Ukraine crisis, Gold exhibited strong safe-haven characteristics during COVID-19 for the NSE 50. Overall, the findings indicate that Gold is the better safe haven. This outcome is consistent with earlier research (Będowska-Sójka & Kliber, 2021; Drake, 2022; Ghazali et al., 2020; Shakil et al., 2018; Triki & Maatoug, 2021). When it comes to Bitcoin, its safe-haven feature is weak. Bitcoin, however, works well as a diversifier and hedge. Therefore, from a policy perspective, investing in safe-haven instruments is crucial to lower the risks associated with asset ownership. Policymakers aiming to enhance the stability of financial portfolios might encourage institutional investors and other market players to incorporate Gold into their asset allocations. Gold’s strong safe-haven qualities, proven across various market conditions, make it a reliable choice. Gold’s performance during crises like COVID-19 highlights its potential to mitigate systemic risks effectively. Further, Bitcoin could also play a complementary role as a hedge and diversifier, especially during periods of significant volatility such as the Ukraine crisis. While Bitcoin’s safe-haven characteristics are relatively weaker, its inclusion in a diversified portfolio offers notable value and hence it should not be overlooked. Further, policymakers may consider how crucial it is to monitor dynamic correlations and periodically rebalance portfolios to account for shifts in the safe haven and hedging characteristics of certain assets. Such measures could help reduce the risks of over-reliance on a single asset type and create more resilient portfolios that can better withstand global economic shocks. For future research, studies can be conducted on the estimation of the rolling window with different widths. This is important to understand how the safe-haven property changes across different holding periods. Further, more equity markets would be included to account for the differences in market capitalization and index constituents. This study can be extended by testing these properties for multi-asset portfolios as well. We intend to take up this study in these directions in the future. Data Availability StatementNot applicable.Declaration of Conflicting InterestsThe authors declared no potential conflicts of interest with respect to the research, authorship, and/or publication of this article.FundingThe authors received no financial support for the research, authorship, and/or publication of this article.ReferencesAkhtaruzzaman M., Boubaker S., Lucey B. M., & Sensoy A. (2021). Is gold a hedge or a safe-haven asset in the COVID-19 crisis? Economic Modelling, 102, 105588. Crossref. Web of Science.Al-Nassar N. S. (2024). Can gold hedge against inflation in the UAE? A nonlinear ARDL analysis in the presence of structural breaks. PSU Research Review, 8(1), 151–166. Crossref.Barbu T. C., Boitan I. A., & Cepoi C. O. (2022). Are cryptocurrencies safe havens during the COVID-19 pandemic? A threshold regression perspective with pandemic-related benchmarks. Economics and Business Review, 8(2), 29–49. Crossref.Baur D. G., & Lucey B. M. (2010). Is gold a hedge or a safe haven? An analysis of stocks, bonds and gold. Financial Review, 45(2), 217–229. Crossref.Będowska-Sójka B., & Kliber A. (2021). Is there one safe-haven for various turbulences? The evidence from gold, Bitcoin and Ether. The North American Journal of Economics and Finance, Elsevier, 56, 101390. Crossref.Belhassine O., & Karamti C. (2021). Contagion and portfolio management in times of COVID-19. Economic Analysis and Policy, 72, 73–86. Crossref. PubMed. Web of Science.Bhattacharjee A., Das J., & Kumar S. (2023). Evaluating the symmetrical and asymmetrical linkage between gold price and Indian stock market in the presence of structural change. NMIMS Management Review, 31(4), 288–297. Crossref. Web of Science.Bhuiyan R. A., Husain A., & Zhang C. (2023). Diversification evidence of Bitcoin and Gold from wavelet analysis. Financial Innovation, 9(1), 100. Crossref. PubMed. Web of Science.Bouri E., Azzi G., & Dyhrberg A. H. (2017). On the return-volatility relationship in the Bitcoin market around the price crash of 2013. Economics, 11(1), 2. Crossref.Bouri E., Gupta R., Tiwari A. K., & Roubaud D. (2017). Does Bitcoin hedge global uncertainty? Evidence from wavelet-based quantile-in-quantile regressions. Finance Research Letters, 23, 87–95. Crossref. Web of Science.Bouri E., Shahzad S. J. H., Roubaud D., Kristoufek L., & Lucey B. (2020). Bitcoin, gold, and commodities as safe havens for stocks: New insight through wavelet analysis. The Quarterly Review of Economics and Finance, 77, 156–164. Crossref. Web of Science.Brenner M., & Galai D. (1989). New financial instruments for hedge changes in volatility. Financial Analysts Journal, 45(4), 61–65. Crossref.Capie F., Mills T. C., & Wood G. (2005). Gold as a hedge against the dollar. Journal of International Financial Markets, Institutions and Money, 15(4), 343–352. Crossref.Ceylan Ö. (2022). Hedging Effectiveness of the VIX ETPs: An analysis of the time-varying performance of the VXX. In Handbook of research on new challenges and global outlooks in financial risk management (pp. 384–401). IGI Global. Crossref.Cheema M. A., Faff R., & Szulczyk K. R. (2022). The 2008 global financial crisis and COVID-19 pandemic: How safe are the safe haven assets? International Review of Financial Analysis, 83, 102316. Crossref. PubMed. Web of Science.Conlon T., & McGee R. (2020). Safe haven or risky hazard? Bitcoin during the COVID-19 bear market. Finance Research Letters, 35, 101607. Crossref. PubMed. Web of Science.Demir E., Gozgor G., Lau C. K. M., & Vigne S. A. (2018). Does economic policy uncertainty predict the Bitcoin returns? An empirical investigation. Finance Research Letters, 26, 145–149. Crossref. Web of Science.Drake P. P. (2022). The gold-stock market relationship during COVID-19. Finance Research Letters, 44, 102111. Crossref. PubMed. Web of Science.Dwyer G. P. (2015). The economics of Bitcoin and similar private digital currencies. Journal of Financial Stability, 17, 81–91. Crossref. Web of Science.Dyhrberg A. H. (2015). Hedging capabilities of bitcoin. Is it the virtual gold? Finance Research Letters, 1–6. https://doi.org/10.1016/j.frl.2015.10.025Dyhrberg A. H. (2016). Hedging capabilities of bitcoin. Is it the virtual gold? Finance Research Letters, 16, 139–144. https://doi.org/10.1016/j.frl.2015.10.025 Web of Science.Engle R. (2002). Dynamic conditional correlation: A simple class of multivariate generalized autoregressive conditional heteroskedasticity models. Journal of Business & Economic Statistics, 20(3), 339–350. Crossref. Web of Science.Ghazali M. F., Lean H. H., & Bahari Z. (2020). Does gold investment offer protection against stock market losses? Evidence from five countries. The Singapore Economic Review, 65(02), 275–301. Crossref.Hasan M. B., Hassan M. K., Rashid M. M., & Alhenawi Y. (2021). Are safe haven assets really safe during the 2008 global financial crisis and COVID-19 pandemic? Global Finance Journal, 50, 100668. Crossref. PubMed.Hood M., & Malik F. (2013). Is gold the best hedge and a safe haven under changing stock market volatility? Review of Financial Economics, 22(2), 47–52. Crossref.Huang Y., Duan K., & Mishra T. (2021). Is Bitcoin really more than a diversifier? A pre-and post-COVID-19 analysis. Finance Research Letters, 43, 102016. Crossref.Ji Q., Zhang D., & Zhao Y. (2020). Searching for safe-haven assets during the COVID-19 pandemic. International Review of Financial Analysis, 71, 101526. Crossref. PubMed. Web of Science.Kaczmarek T., Będowska-Sójka B., Grobelny P., & Perez K. (2022). False safe haven assets: Evidence from the target volatility strategy based on recurrent neural network. Research in International Business and Finance, 60, 101610. Crossref. Web of Science.Kumar A. S., & Padakandla S. R. (2022). Testing the safe-haven properties of gold and bitcoin in the backdrop of COVID-19: A wavelet quantile correlation approach. Finance Research Letters, 47, 102707. Crossref. PubMed. Web of Science.Kumar M. A., Swathi J., Pallavi T. A., & Bavana S. (2023). Volume progression and price–volume relationship of commodity futures: Case of bullion and base metals. NMIMS Management Review, 31(4), 265–274. https://doi.org/10.1177/09711023241230463 Web of Science.Liu C. S., Chang M. S., Wu X., & Chui C. M. (2016). Hedges or safe havens—Revisit the role of gold and USD against stock: A multivariate extended skew-t copula approach. Quantitative Finance, 16(11), 1763–1789. Crossref.Liu R., Zhichao S., Wei G., & Wang W. (2017). GARCH model with fat-tailed distributions and Bitcoin exchange rate returns. Journal of Accounting, Business and Finance Research, 1(1), 71–75. https://doi.org/10.2139/ssrn.3666106 Crossref.Mokni K. (2021). When, where, and how economic policy uncertainty predicts Bitcoin returns and volatility? A quantiles-based analysis. The Quarterly Review of Economics and Finance, 80, 65–73. Crossref.Nagy B. Z., & Benedek B. (2021). Higher co-moments and adjusted Sharpe ratios for cryptocurrencies. Finance Research Letters, 39, 101543. Crossref. Web of Science.Nakamoto S. (2008). Bitcoin: A peer-to-peer electronic cash system. Bitcoin. https://bitcoin.org/bitcoin.pdfOkorie D. I. (2020). Could stock hedge Bitcoin risk(s) and vice versa? Digital Finance, 2(1), 117–136. Crossref.Paule-Vianez J., Prado-Román C., & Gómez-Martínez R. (2020). Economic policy uncertainty and Bitcoin. Is Bitcoin a safe-haven asset? European Journal of Management and Business Economics, 29(3), 347–363. Crossref.Ratner M., & Chiu C. C. J. (2013). Hedging stock sector risk with credit default swaps. International Review of Financial Analysis, 30, 18–25. Crossref. Web of Science.Salisu A. A., Raheem I. D., & Vo X. V. (2021). Assessing the safe haven property of the gold market during COVID-19 pandemic. International Review of Financial Analysis, 74, 101666. Crossref. PubMed. Web of Science.Saxena S., & Villar A. (2008). Hedging instruments in emerging market economies. Financial globalisation and emerging market capital flows. BIS Papers, 44, 71–87.Selmi R., Mensi W., Hammoudeh S., & Bouoiyour J. (2018). Is Bitcoin a hedge, a safe haven or a diversifier for oil price movements? A comparison with gold. Energy Economics, 74, 787–801. Crossref. Web of Science.Shahzad S. J. H., Bouri E., Roubaud D., Kristoufek L., & Lucey B. (2019). Is Bitcoin a better safe-haven investment than gold and commodities? International Review of Financial Analysis, 63, 322–330. Crossref. Web of Science.Shakil M. H., Mustapha I. H. M., Tasnia M., & Saiti B. (2018). Is gold a hedge or a safe haven? An application of ARDL approach. Journal of Economics, Finance and Administrative Science, 23(44), 60–76. Crossref.Singh V. V., Singh H., & Ansari A. (2024). Bitcoin as a distinct asset class for hedging and portfolio diversification: A DCC-GARCH model analysis. NMIMS Management Review, 32(1), 7–13. Crossref. Web of Science.Smales L. A. (2019). Bitcoin as a safe haven: Is it even worth considering? Finance Research Letters, 30, 385–393. Crossref. Web of Science.Snene Manzli Y., Alnafisah H., & Jeribi A. (2024). Safe haven ability of energy and agricultural commodities against G7 stock markets and banking indices during COVID-19, Russia–Ukraine War, and SVB collapse: Evidence from the wavelet coherence approach. Discrete Dynamics in Nature and Society, 2024(1), 2587000. Crossref.Syuhada K., Suprijanto D., & Hakim A. (2022). Comparing gold’s and Bitcoin’s safe-haven roles against energy commodities during the COVID-19 outbreak: A vine copula approach. Finance Research Letters, 46, 102471. Crossref. PubMed. Web of Science.Tarchella S., Khalfaoui R., & Hammoudeh S. (2024). The safe haven, hedging, and diversification properties of oil, gold, and cryptocurrency for the G7 equity markets: Evidence from the pre-and post-COVID-19 periods. Research in International Business and Finance, 67, 102125. Crossref. Web of Science.Triki M. B., & Maatoug A. B. (2021). The GOLD market as a safe haven against the stock market uncertainty: Evidence from geopolitical risk. Resources Policy, 70, 101872. Crossref. Web of Science.Umar Z., Bossman A., Choi S. Y., & Teplova T. (2023). The relationship between global risk aversion and returns from safe-haven assets. Finance Research Letters, 51, 103444. Crossref. Web of Science.Ustaoglu E. (2022). Safe-haven properties and portfolio applications of cryptocurrencies: Evidence from the emerging markets. Finance Research Letters, 47, 102716. Crossref. Web of Science.Widjaja M., & Havidz S. A. H. (2023). Are gold and cryptocurrency a safe haven for stocks and bonds? Conventional vs Islamic markets during the COVID-19 pandemic. European Journal of Management and Business Economics (ahead-of-print).Yan Y., Lei Y., & Wang Y. (2022). Bitcoin is a safe-haven asset and a medium of exchange. Axioms, 11(8), 415. Crossref.Yousaf I., Plakandaras V., Bouri E., & Gupta R. (2022). Hedge and safe haven properties of gold, US Treasury, Bitcoin, and Dollar/CHF against the FAANA companies and S&P 500 (Department of Economics, Working Paper Series No. 2022–27). University of Pretoria.Zhang Y., Zhu P., & Xu Y. (2021). Has COVID-19 changed the hedge effectiveness of bitcoin? Frontiers in Public Health, 9. https://doi.org/10.3389/fpubh.2021.704900
Energy & Economics
tsmc is a Taiwanese collective circuit manufacturing company with advanced manufacturing processes

US Semiconductor Reindustrialization: Implications for the World

by Anastasia Tolstukhina

In recent years, US leadership has embraced techno-nationalism amid geopolitical and technological rivalry with China, aiming to minimise reliance on imported chips from Asia. These components are crucial for producing consumer goods, military hardware, and AI systems. The United States set the ambitious goal of developing a self-sufficient semiconductor supply chain during Donald Trump’s first term, and continued under Joe Biden. There is consensus in the United States on the critical role of unfettered access to chips when it comes to ensuring economic and national security. It is unlikely that this technological policy dynamic will undergo significant shifts in the foreseeable future. Despite a shared objective among both Republicans and Democrats to revive the US semiconductor industry, their approaches diverge significantly. Donald Trump has his own vision for advancing this sector, one that contrasts sharply with Joe Biden’s strategy. For instance, Trump has criticised aspects of Biden-era initiatives, including the 2022 CHIPS and Science Act, which he has called counterproductive. Trump, on the other hand, favours a more aggressive tariff policy and a reduction in federal spending, arguing that major tech companies can do well without additional government support. The future balance of power—both technological and geopolitical—among the key global actors will be shaped by the development trajectory of the US semiconductor industry. Biden’s semiconductor legacy The United States holds a dominant position in chip design, but maintains a relatively modest share in global semiconductor manufacturing—just 10 percent according to SIA data in 2022, and slightly up to 11 percent according to 2025 data provided by TrendForce research firm. Major US tech giants like Nvidia or Qualcomm remain heavily reliant on chips produced in Taiwan. This dependency has increasingly been seen as unacceptable by US leadership, especially in the context of the ongoing tech war with China. Washington now views such reliance as a significant national security risk. During Donald Trump’s first presidential term, the decision was made to attract leading chip manufacturers—most notably Taiwan Semiconductor Manufacturing Company (TSMC), the world’s largest contract chipmaker—to set up operations in the United States. This initiative proved successful: in 2020, TSMC agreed to invest $12 billion to build a chip fabrication plant in Arizona (Fab 21).   The Biden administration continued Trump’s push to revitalise the semiconductor industry. In August 2022, the CHIPS and Science Act was passed, allocating about $53 billion in government subsidies for the semiconductor sector, along with tax incentives to encourage both foreign and domestic firms to establish chip manufacturing operations on US soil. Additionally, the CHIPS for America programme was introduced to address several key goals, namely, to secure a stable supply chain for both cutting-edge and legacy semiconductors, to reinforce US leadership in R&D, and to boost employment, as investment in the chip industry was expected to generate hundreds of thousands of new jobs in microelectronics-related fields. Biden’s programme has borne fruit. Major chipmakers have launched large-scale construction of fabs across the United States. In 2022, Intel started building a $28 billion facility in Ohio; Samsung initiated two plants in Texas worth about $40 billion; and TSMC decided to expand its Arizona site to three modules, increasing its total investment from $12 billion to $65 billion. According to TSMC CEO C.C. Wei, the Arizona facility began mass production in the fourth quarter of 2024 using its N4 (4nm class) process technology, with performance comparable to its fabs in Taiwan. This marks the most advanced semiconductor production facility currently operating in the United States. Plans are in place to launch a second module for 3nm chip production by 2028, followed by a third module by 2030, which will manufacture 2nm and 1.6nm chips and their variants. The Biden team aimed for the United States to capture 20 percent of global advanced chip manufacturing by 2030. Democrats have adopted a comprehensive approach to rebuilding the semiconductor industry not just focusing on building advanced fabs, but also investing in support areas such as chip testing and packaging, materials production, and R&D. A substantial $13 billion in federal funds has been earmarked for these purposes. For instance, grants and loans were used to support GlobalFoundries’ plans to build an advanced packaging and photonics centre in New York State. Arizona State University also received significant support from the US Department of Commerce, including a $100 million allocation for research and development in next-generation chip packaging technologies. Wide geographic distribution is a striking feature of the emerging US semiconductor supply chain (Figure 1). Key activities are being established across numerous states: Oregon (semiconductor manufacturing), Idaho (semiconductor and material manufacturing), Utah (semiconductor manufacturing), Montana (equipment manufacturing), Colorado (semiconductor and material manufacturing), New Mexico (packaging), Kansas (semiconductor manufacturing and packaging), Louisiana (equipment manufacturing), Missouri (materials), Minnesota (semiconductor manufacturing),Michigan (materials),Indiana (packaging and semiconductor manufacturing), Ohio (materials and semiconductor manufacturing), Vermont (semiconductor R&D and manufacturing), Pennsylvania (materials), North Carolina (semiconductor manufacturing), Georgia (materials and semiconductor manufacturing), and Florida (materials and semiconductor manufacturing). Among these, several states stand out for their significance and comprehensive involvement: California (semiconductor manufacturing and R&D), Arizona (semiconductor, equipment, and material manufacturing, packaging, R&D), Texas (semiconductor and material manufacturing, packaging, R&D), and New York (materials, semiconductor manufacturing, and R&D).   According to a 2024 study by the Boston Consulting Group commissioned by the Semiconductor Industry Association (SIA), over 90 projects have been launched in 28 states since the CHIPS Act was passed, totalling nearly $450 billion in private investment. However, the Biden administration did not pursue full semiconductor self-sufficiency as a goal. There was recognition that recreating the entire supply chain domestically would, even at the initial stage, require a vast amount of time and financial resourcesНадпись: MichiganНадпись: IndianaНадпись: Pennsylvania estimated at around $1 trillion. Therefore, US policymakers have advocated for a collective semiconductor supply chain among allies and partners by building international alliances. In 2022, the Unite States proposed creating the CHIP 4 alliance (United States, South Korea, Japan, and Taiwan), which, with coordinated efforts, could have become a dominant force in the semiconductor industry capable of influencing nearly every segment of the global value chain, with the exception of assembly and testing, where mainland China currently plays a leading role. In this way, Trump’s initiative to revive the semiconductor industry has not only continued under Biden, but evolved into a more ambitious and costly programme. The SIA, in its above report, painted an optimistic picture for the future of the US semiconductor sector. It projects that chip manufacturing capacity in the United States will triple over the next decade (2022–2032), growing by 203 percent. This expansion is expected to require $646 billion in investment, or 28 percent of global capital spending in the semiconductor industry. As a result, the United States could increase its share of global chip production from the current 10 percent to 14 percent by 2032. Additionally, experts estimate that the new projects will create over 58,000 new jobs in the semiconductor sector and hundreds of thousands more in related industries.   Despite its ambitious nature, the initial phase of Biden’s semiconductor programme has revealed several challenges. The industry has run into numerous internal obstacles slowing the construction of manufacturing facilities, including a shortage of skilled labour, high labour and construction material costs, bureaucratic hurdles (e.g., obtaining environmental permits), slow disbursement of promised subsidies by the US authorities, union-related delays, cultural differences, and more. These issues have caused delays in launching chip fabrication plants, thereby slowing the pace at which the US can achieve relative technological autonomy in the rapidly evolving semiconductor field. For example, TSMC postponed the start of mass production at the first module of Fab 21 from 2024 to 2025, and delayed the second module from 2026 to 2027–2028. Intel’s costly attempt to reclaim leadership in advanced chip manufacturing has strained its budget, forcing the company to delay its Ohio fab launch from 2025 to 2030. Samsung, initially planning to start production in Texas in the second half of 2024, pushed the timeline to 2025. These delays in fab construction also impacted the schedules of launching supplier plants, including chemical and material producers like LCY Chemical, Solvay, Chang Chun Group, KPPC Advanced Chemicals (Kanto-PPC), and Topco Scientific. The external component of the Biden administration’s technology policy has also failed to develop as envisioned. After several years of existence, the CHIP 4 has failed to become a multilateral coordination mechanism, and its potential members have not assumed any binding commitments. Only one virtual meeting was held in 2023. The reason lies in internal disagreements within the alliance and concerns about various risks, including geopolitical ones. Under the Biden administration, the United States made a strong start in the semiconductor sector, launching a wide range of fab construction projects and attracting billions of dollars in public and private investment. However, the process of reviving the US semiconductor industry has proven slower than anticipated. Government subsidies have been disbursed sluggishly, with some companies yet to receive their funding, and the construction of many high-tech industrial facilities has been postponed. Moreover, Biden overestimated the willingness of US allies and partners to join formal technological alliances. Trump’s radical approach To encourage both domestic and foreign chip suppliers to set up manufacturing in the United States, Donald Trump, in contrast to Joe Biden, chose coercion (tariffs) over incentives (government subsidies). Criticising his predecessor’s CHIPS Act, Trump argued that companies didn’t need money, but rather motivation in the form of import tariffs ranging from 25 percent to 100 percent. In his view, such measures would compel businesses to invest in US chip manufacturing, especially since these companies have the financial capacity and, therefore, don’t need to rely on government funding. Almost immediately after taking office, Trump threatened chip manufacturers with higher tariffs. At first glance, this move might seem economically illogical. Why, for instance, punish TSMC—a key partner of major US fabless companies like Nvidia, Apple, and Qualcomm—especially when there is no comparable alternative, either in the United States or globally? Even Intel, despite its struggles, depends on wafers from the Taiwanese firm (its import dependency is about 30 percent). Yet despite apparent lack of logic, the “stick” approach proved effective. In early March 2025, TSMC announced plans to invest approximately $100 billion to build three new fabs for high-performance semiconductor wafers, two advanced chip packaging plants, and one R&D centre. This raises the question: did the world’s largest chipmaker really get spooked by Trump’s tariff threats and, therefore, decide to make an unprecedented investment in the US economy? In theory, TSMC—sitting in the centre of the global microelectronics industry—could have passed tariff-related costs on to its American clients, who would have had little choice but to continue purchasing its products due to the lack of viable alternatives. Furthermore, a significant share of TSMC’s semiconductors is not shipped directly to the United States, but instead follows a supply chain tour through Asia, where the bulk of chip packaging, testing, and electronics assembly occurs (this infrastructure is only just beginning to take shape in the United States, and that process is anything but fast). Analysts at Bernstein suggest that political pressure, rather than tariffs themselves, drove TSMC’s decision. That assessment holds some merit, but it appears that a combination of factors was at play. First, TSMC itself is interested in expanding its global presence. Taiwan’s Minister of Economic Affairs Kuo Jyh-Huei commented on TSMC’s $100 billion investment in the US semiconductor sector by saying, “TSMC already has plants in the United States and Japan, and is now building a new one in Germany. This has nothing to do with tariffs. TSMC’s global expansion is a major development.” Similarly, in 2020 during Trump’s first term, company representatives said that the decision to build a plant in Arizona was “based on business needs.” Indeed, the move offers several benefits to TSMC, including increased company capitalisation and minimised risks in the event of conflict with mainland China or natural disasters (earthquakes are not uncommon in Taiwan). Second, the United States remains TSMC’s primary market, and the tariff threat did play its part. In Taiwan, there’s an understanding that when Trump talks about higher tariffs, he isn’t bluffing, because his seriousness was evident during his first term and was experienced first-hand by Canada and Mexico. On April 2, 2025, nearly the entire rest of the world—including Taiwan—faced a new wave of tariffs, with Taiwanese exports to the United States hit by a 32 percent duty (though semiconductors were not yet affected). A 100-percent tariff on semiconductors is unlikely, as it would significantly damage the market value of US tech firms. Still, protective barriers on semiconductors are expected—Trump’s administration has promised to implement them in the coming months. These measures aim to level the production cost of chips between the United States and Taiwan, thereby enhancing the competitiveness of US-made semiconductors. And finally, TSMC, together with the Taiwanese authorities, is not willing to mar relations with the United States for political reasons. This became evident from TSMC’s earlier decision to support US sanctions against mainland China by refusing to supply its most advanced chips manufactured using 7nm and more sophisticated process technologies even though that market had been a significant source of profit. After TSMC announced plans to expand its presence in the United States, the Trump administration decided to take more radical action and to scrap the CHIPS and Science Act, a signature achievement of the Biden administration. However, some Republican members of Congress are calling for the law to be preserved, albeit with certain amendments. Trump’s hands are not completely untied in this regard, so it is unlikely he can ignore Congress’s position. Even if the legislation gets amended, the process will likely be drawn out, as the CHIPS and Science Act received bipartisan support and has many supporters among Republicans. Another strategically important issue for the Trump administration is the competitiveness of domestic manufacturers. According to the Taiwanese leadership, TSMC will continue to expand operations in Taiwan, and the most advanced semiconductor technologies will not leave the country. For “the most powerful AI chips in the world to be made right here in America” efforts will be needed on the part of national champions—and soon. In 2025, the leader in producing the most advanced 2nm chips will be determined. The main contenders in this race are TSMC, Samsung, and Intel. Intel, however, finds itself in a difficult position. The company has been facing serious financial troubles for several years and lags behind competitors in mastering cutting-edge production processes. The year 2024 was one of Intel’s most challenging: it underwent a major restructuring (creating a separate chip manufacturing unit, Intel Foundry), posted record losses of $18 billion, and saw a significant drop in its stock price. As a result, about 15 percent of the workforce, including CEO Pat Gelsinger, was laid off; dividend payments were suspended; and a sweeping cost-cutting plan was launched, including deep cuts in capital expenditures over the coming years and a scaling back of global expansion plans. According to Intel Products CEO Michelle Johnston Holthaus, the company failed to capitalise effectively on the artificial intelligence boom and continues to fall behind its competitors technologically. Although Intel plans to begin 18A (2nm) chip production in 2025, there are no guarantees of competitiveness in power efficiency, performance, yield rate, cost, or timely mass production. In March, media reported that Nvidia and Broadcom began testing certain chip components, but such testing, of course, does not guarantee Intel will secure orders. Apparently, the Trump administration itself has doubts about the US company’s capabilities, as it has proposed that TSMC acquire shares in Intel Foundry. Negotiations with the Asian manufacturer began only in February 2025, meaning they are still at a very early stage.   What short-term challenges does the Trump administration face in revitalising the US semiconductor industry? Technological lag There is a high likelihood that the United States will continue to lag behind Taiwan for several years in the production of advanced semiconductors. TSMC plans to begin producing chips using a 1.4nm process by 2028, while on US soil—if deadlines aren’t pushed back again—the Taiwanese firm will only be producing 3nm chips by that time. Although some hope is being placed on Intel, there is no guarantee that the American champion will be able to compete with TSMC, or that a potential collaboration with TSMC (if it acquires a stake in Intel Foundry) will be successful. Inadequate production capacity Experts estimate that the output capacity of TSMC’s factories under construction in Arizona is less than one-fifth of the company’s 5nm and 3nm capacity in Taiwan. According to analysts at Bernstein Research, with the deployment of additional production in Arizona, the United States could raise its self-sufficiency in advanced chip production to 40-50 percent between 2030 and 2032. In the near term, this would only cover about half of the chip demand from US tech giants. Moreover, TSMC has not specified clear timelines or technologies for its US expansion. Intel could partly close the gap, but that depends on how competitive its chips are and how quickly it can overcome its financial difficulties. Slow rollout of production facilities TrendForce forecasts that the US share of global advanced chip production could grow from 11 percent to 22 percent by 2030. However, the construction of TSMC’s first Arizona plant took nearly five years, and there are no guarantees that future factories will be built fast enough to double US chip output by 2030. Labour shortage Developing a relatively self-sufficient microelectronics ecosystem requires a highly skilled workforce. However, the United States is facing severe staff shortages. By 2030, estimates suggest a shortfall of 67,000 to 90,000 professionals in the semiconductor field. China’s response to US sanctions The United States is not the only country leveraging interdependence in the semiconductor industry as a tool of pressure. China is responding in kind, though currently in a relatively restrained manner. In 2024, the Chinese government decided to completely ban exports of gallium, germanium, antimony, and ultra-hard materials to the United States even though the restrictions apply only to direct shipments. These actions not only drive up raw material prices (e.g., antimony prices more than tripled since early 2024), but also force US authorities to consider domestic mining and search for alternative suppliers abroad. High production costs According to the SIA, building and operating chip fabs in the United States is 30 to 50 percent more expensive than in Asia. Unofficial reports suggest that chips made at Fab 21 in Arizona cost 10 percent to 30 percent more than their Taiwanese counterparts (more precise figures are not publicly available). The high cost is attributed to expensive construction of facilities, high salaries (US engineers earn three times more than their Taiwanese counterparts, incomplete domestic semiconductor supply chains (some materials must still be imported)—TSMC CEO has complained about it—and complex logistics (finished wafers often need to be sent back to Taiwan or elsewhere for packaging).70 Even if tariffs eventually equalise chip pricing, US fabless companies like Apple or Nvidia may still find it more economical to source chips from Asia, where a properly functioning semiconductor ecosystem already exists—unlike in the United States, where such infrastructure is still in its infancy. Trump’s current tariff policy Imposing tariffs could lead to a significant increase in prices for components, equipment, and materials, while also injecting uncertainty into the semiconductor industry. For instance, it remains unclear how semiconductor manufacturers will operate under new tariffs on imported chip-making equipment sourced from the EU, Japan, South Korea, and Taiwan. The cost of such equipment can reach hundreds of millions of dollars—for example, the latest Low-NA EUV lithography machine from Dutch company ASML is priced at $235 million. If Intel, TSMC, and other firms are required to pay import duties of 20 percent or more, chip manufacturing in the United States will become prohibitively expensive, undermining investment plans of the manufacturers that have committed to building advanced fabs on American soil. Naturally, US officials understand that sharp moves in semiconductor policy—such as an aggressive tariff regime—carry significant risk and could spark a true technological crisis. In April 2025, the US Department of Commerce’s Bureau of Industry and Security (BIS) launched an investigation under Section 232 of the Trade Expansion Act of 1962 to determine the impact of semiconductor imports and related equipment on national security. Interested parties submitted comments, many urging extreme caution in this highly sensitive sector, which depends on a complex global supply chain split across multiple phases and countries. Thus, SIA recommended that any tariffs be phased in gradually to allow the US industry to continue functioning efficiently until domestic production capabilities are fully established. The US Chamber of Commerce called for restraint, warning that comprehensive tariffs on the semiconductor supply chain could damage US industry and undermine cooperation with allies and partners in achieving key national security goals. The Chamber also noted that foreign semiconductor companies have made long-term investment commitments to build capacity in the United States, and that political uncertainty and instability could jeopardise the stated goal of re-shoring semiconductor supply chains. *** As TSMC founder Morris Chang once said, America’s effort to ramp up its own chip production may well prove to be “a very expensive exercise in futility.” Microelectronics is one of the most complex industries in the world requiring not only massive financial investment, but also time. For decades, the industry developed within the framework of global division of labour. Now, building a relatively self-sufficient supply chain within a single country could take just as long. Yet, in the medium and long term, America’s push to revive its semiconductor industry may prove justified. The United States holds a strong position in the sector, and US companies control about 50 percent of the global semiconductor market. Furthermore, the United States remains a powerful magnet for talent, and possesses vast financial and political resources. Some experts believe that over time, the United States could weaken Taiwan’s dominance as the global hub of advanced chip manufacturing. The resurgence of the US semiconductor industry will reshape the global technological order in three key ways. First, it will trigger a transformation of the global semiconductor supply chain. Second, it will lead to greater US independence from imports of critical technologies, which means erosion of importance of some players in the industry, weakening their “technological shield”. Finally, it will cement US technological superiority in many critical industries, from AI to military systems, accelerating a global technological divide with profound geopolitical consequences. Indeed, America has the potential to become one of the world’s leading semiconductor production centres, provided that several key conditions are met, such as a favourable geopolitical environment, domestic political stability, and the absence of disruptive black swan events. However, Trump’s risky tariff policy could trigger unpredictable cascading effects, both domestically (e.g., higher prices for electronics and microelectronics products) and internationally (e.g., retaliatory tariffs by US trade partners), posing serious threats for the US semiconductor industry. First published in the Valdai Discussion Club.

Energy & Economics
Xi Jinping and Vladmir Putin at welcoming ceremony (2024)

Russia and China in the Era of Trade Wars and Sanctions

by Ivan Timofeev

Economic relations between Russia and China remain high. Beijing has become Moscow's most important trading partner, and in the context of Western sanctions, it has also become an alternative source of industrial and consumer goods, as well as the largest market for Russian energy and other raw materials. At the same time, external political factors may have a growing influence on Russian-Chinese economic relations. These include the trade war between China and the United States, a possible escalation of US sanctions against Russia, and the expansion of secondary sanctions by the European Union against Chinese companies. The trade war, in the form of increased import duties on imported goods, has become one of the calling cards of Donald Trump's second term in office. The executive order he issued on April 2, 2025, provided a detailed conceptual justification for such a policy. The main goal is the reindustrialisation of the United States through the return or transfer of industrial production to the territory of the US, as well as an equalization of the trade balance with foreign countries. The basic part of Trump's order concerned all countries throughout the world and assumes a tariff increase of 10%. It goes on to determine individual duties on the goods of more than 70 countries, with its own sets for each. China became one of the few countries which decided to mirror the tariff increases. This led to a short-lived and explosive exchange of increases in duties. While it was suspended by negotiations between the two countries in Geneva, it was not removed from the agenda. In the US trade war “against the whole world”, China remains a key target. This is determined by the high level of the US trade deficit in relations with China, which has persisted for more than 40 years. Apparently, it remained comfortable for the US until China made a noticeable leap in the field of industrial and technological development. Such a leap allowed China to gradually overcome its peripheral place in the global economy, displace American and other foreign goods from the domestic market, and occupy niches in foreign markets. Despite the critically important role of American components, patents and technological solutions in a number of industries, China has managed to reduce its dependence on them. The growing industrial and technological power of the PRC is becoming a a political problem for the US. It was clearly identified during the first term of Trump's presidency. Even then, the US pursued a course toward the technological containment of China. Despite the temporary respite in the trade war, US pressure on China will remain. The tariff policy may be supplemented by restrictive new measures (sanctions) in the field of telecommunications and other industries. During the new term of Donald Trump's presidency, the politicisation of issues that the Biden administration avoided putting at the forefront of US-Chinese relations began again. These include the problem of Hong Kong autonomy and the issue of ethnic minorities in the Xinjiang Uyghur Autonomous Region of China. Both issues received a high level of politicisation during Trump's first term. The US-China trade war has so far had little effect on Russian-Chinese relations. The increase in US tariffs has had virtually no effect on Russia. Russia is already facing a significant number of restrictive measures, and the volume of trade with the United States has been reduced to near zero since the start of Moscow’s Special Military Operation in 2022. However, Russia may feel the effects of the trade war. For example, the United States may require China to purchase American energy resources as a measure to correct the trade balance. Obviously, such a measure is unlikely to solve the imbalance. However, it has the potential to affect the volume of Russian oil supplies to China in one way or another. In addition, the trade war as a whole may affect oil prices downwards, which is also disadvantageous for Russia. On the other hand, Russia is a reliable supplier of energy resources for China, which will not politicise them. Even in the context of new aggravations of the trade war, China is unlikely to refuse Russian supplies. Another factor is US sanctions against Russia. After the start of Russian-American negotiations on Ukraine in 2025, Washington avoided using new sanctions, although all previously adopted restrictive measures and their legal mechanisms are in force. However, Donald Trump failed to carry out a diplomatic blitzkrieg and achieve a quick settlement. The negotiations have dragged on and may continue for a long time. If they fail, the United States is ready to escalate sanctions again. Existing legal mechanisms allow, for example, for an increase in the list of blocked persons, including in relation to Chinese companies cooperating with Russia. This practice was widely used by the Biden administration. It was Chinese companies that became the key target of US secondary sanctions targeting Russia. They fell under blocking financial sanctions for deliveries of industrial goods, electronics and other equipment to Russia. However, there was not a single large company among them. We were talking about small manufacturing companies or intermediary firms. At the same time, the Biden administration managed to significantly complicate payments between Russia and China through the threat of secondary sanctions. US Presidential Executive Order 14114 of December 22, 2023 threatened blocking sanctions against foreign financial institutions carrying out transactions in favour of the Russian military-industrial complex. In practice, such sanctions against Chinese financial institutions were practically not applied, except for the blocking of several Chinese payment agents in January 2025. However, the very threat of secondary sanctions forced Chinese banks to exercise a high level of caution in transactions with Russia. This problem has not yet been fully resolved. New legal mechanisms in the field of sanctions, which are being worked on in the United States, may also affect Russian-Chinese relations. We are talking about the bill introduced by US Senator Lindsey Graham and several other senators and members of congress. Their bill assumes that in the event of failure of negotiations with Russia on Ukraine, the US executive branch will receive the authority to impose 500% duties on countries purchasing Russian raw materials, including oil. China may be among them. This threat should hardly be exaggerated for now. The passage of the bill is not predetermined. Even if it is signed into law, the application of 500% tariffs against China will be an extremely difficult matter. Recent rounds of the trade war have shown that China is ready for retaliatory measures. However, the emergence of such a norm will in any case increase the risks for business and may negatively affect Russian suppliers of raw materials. Another factor is EU sanctions policy. Unlike the US, the EU continues to escalate sanctions against Russia despite the negotiations on Ukraine. Brussels is expanding the practice of secondary sanctions, which also affect Chinese companies. In the context of a deepening economic partnership between China and the EU, this factor seems significant. However, in reality, it will play a peripheral role. The EU's practice of secondary sanctions is still significantly more limited than the American one. It does not affect any significant Chinese companies. Problems may be created by the expansion of EU bans on the provision of financial messaging services for Russian banks—this will affect their relations with Chinese counterparties. But such bans stimulate the acceleration of the use of the Chinese CIPS payment system by Russians, which has the functionality of transmitting financial messages. Compared to the US, the EU policy factor remains secondary. First published in the Valdai Discussion Club.

Energy & Economics
The Strait of Hormuz, the Gulf of Oman, and Iran pinned on a political map, February 1, 2024

The Economic Effects of Blockage of the Strait of Hormuz

by World & New World Journal Policy Team

한국어로 읽기 Leer en español In Deutsch lesen Gap اقرأ بالعربية Lire en français Читать на русском I. Introduction On 13 June 2025, Israel attacked more than a dozen locations across Iran in the largest assault on the country since the Iran-Iraq war of the 1980s. Beginning on the evening of 13 June, Iran retaliated by launching ballistic missiles and drones at Israel. Conflicts between the two countries have intensified. Amid intensified conflicts between Israel and Iran, the US attacked Iran by bombing three Iranian nuclear sites on 22 June 2025. In retaliation for these attacks from the US and Israel, Iran may consider closing or blocking the Strait of Hormuz. In fact, Iran’s parliament has reportedly approved of the closing of the Strait of Hormuz on 22 June 2025. However, on 24 June 2025, President Trump announced a ceasefire between Iran and Israel, thereby reducing the possibility of the blockage of the Strait of Hormuz by Iran. Nonetheless, there is still a possibility that conflicts between Iran and Israel continue and then Iran may reconsider the closing of the Strait. This is because the ceasefire is so fragile that the conflicts between Israel and Iran can take place at any time. If the closing of the Strait of Hormuz happens, it will have significant impacts on global economy, in particular on Asian economies, because 84% of the crude oil and condensate and 83% of the liquefied natural gas that moved through the Strait of Hormuz went to Asian markets in 2024. This paper analyzes the impacts of Iran’s closure or blockage of the Strait of Hormuz on the global economy with a focus on Asian economies. II. Examples of Geopolitics Impacting Energy Prices Crude oil remains the world's most geopolitically charged commodity. Despite robust supply growth and growing energy transitions, as Figure 1 shows, turmoil in oil-producing regions such as Russian invasion of Ukraine in 2022 continues to ripple through prices.   Figure1: Examples of Geopolitics Impacting Crude Oil Prices As Figure 2 shows, in June 2025, global oil price surged into the mid‑$70s per barrel amid escalating Iran–Israel tensions and threats to the Strait of Hormuz. In mid‑June 2025, Israeli airstrikes on Iranian nuclear infrastructure led to an immediate 7–11% increase in the Brent crude oil price. The market reacted swiftly to the geopolitical risk, particularly over fears of supply disruption through the Strait of Hormuz. Iranian lawmakers, who threatened to close the Strait of Hormuz, finally approved of closing the Strait on 22 June 2025. While tanker traffic continued, the Brent crude oil price briefly climbed to $79.50 and then dropped to $74.85.   Figure 2: Movements of crude oil (WTI) and Brent oil prices III. The importance of the Strait of Hormuz 1. Location of the Strait of Hormuz As Figure 3 shows, the Strait of Hormuz, located between Oman and Iran, connects the Persian Gulf with the Gulf of Oman and the Arabian Sea. The strait is deep enough and wide enough to handle the world's largest crude oil tankers, and it is one of the world's most important oil chokepoints.  Figure 3: Picture of the Strait of Hormuz 2. Oil flows through the Strait of Hormuz As Table 1 shows, large volumes of oil flow through the Strait of Hormuz, and very few alternative options exist to move oil out of the strait if it is closed. In 2024, oil flow through the strait averaged 20 million barrels per day (b/d), or the equivalent of about 20% of global petroleum liquids consumption. In the first quarter of 2025, total oil flows through the Strait of Hormuz remained relatively flat compared with 2024.  Table 1: volume of crude oil, condensate, petroleum transported through the Strait of Hormuz Although we have not seen maritime traffic through the Strait of Hormuz blocked following recent tensions in the region, the price of Brent crude oil (a global benchmark) increased from $69 per barrel (b) on June 12 to $74/b on June 13, 2025. This fact highlights the importance of the Strait to global oil supplies. Chokepoints are narrow channels along widely used global sea routes that are critical to global energy security. The inability of oil to transit a major chokepoint, even temporarily, can create substantial supply delays and raise shipping costs, potentially increasing world energy prices. Although most chokepoints can be circumvented by using other routes—often adding significantly to transit time—some chokepoints have no practical alternatives. Most volumes that transit the Strait of Hormuz have no alternative means of exiting the region, although there are some pipeline alternatives that can avoid the Strait. 3. Destinations Flows through the Strait of Hormuz in 2024 and the first quarter of 2025 made up more than one-quarter of total global seaborne oil trade and about one-fifth of global oil and petroleum product consumption. In addition, around one-fifth of global liquefied natural gas trade also transited the Strait of Hormuz in 2024, primarily from Qatar. Based on tanker tracking data published by Vortexa, Saudi Arabia moves more crude oil and condensate through the Strait of Hormuz than any other country. In 2024, exports of crude and condensate from Saudi Arabia accounted for 38% of total Hormuz crude flows (5.5 million b/d). As Figure 4 shows, 84% of the crude oil and condensate and 83% of the liquefied natural gas that transported through the Strait of Hormuz went to Asian nations in 2024. China, India, Japan, and South Korea were the top destinations for crude oil moving through the Strait of Hormuz. Asia accounted for a combined 69% of all Hormuz crude oil and condensate flows in 2024. These Asian markets would likely be most affected by supply disruptions at Hormuz.  Figure 4: volume of crude oil and condensate transported through the strait of Hormuz In 2024, the United States imported about 0.5 million b/d of crude oil and condensate from Persian Gulf countries through the Strait of Hormuz, accounting for about 7% of total U.S. crude oil and condensate imports and 2% of U.S. petroleum liquids consumption. In 2024, U.S. crude oil imports from countries in the Persian Gulf were at the lowest level in nearly 40 years as domestic production and imports from Canada have increased. IV. Economic Effects of the Blockade of the Strait of Hormuz Iran has repeatedly threatened to block the Strait of Hormuz, notably during crises with the United States in 2011, 2018 and 2020. So far, these threats have never materialized into a total closure, but the mere mention of them is enough to provoke crude oil price rises. According to many economists and energy experts, a blockade of the Strait of Hormuz would have significant economic impacts, including sharp increases in oil prices, disruptions to global supply chains, and potential economic sanctions. These effects could ripple through various sectors, affecting businesses, consumers, and global economies alike. The 2021 Suez Canal blockage provides a relevant, if smaller-scale, precedent. The six-day disruption in the Suez Canal caused approximately $9.6 billion per day in global trade delays according to Lloyd's List Intelligence. A Strait of Hormuz closure would likely generate significantly larger economic impacts given the strategic importance of the energy resources involved. 1. Short-term Impacts of the blockade of the Strait of Hormuz Main short-term effects of the blockage of the Strait of Hormuz are as follows:· Increased Oil Prices:A blockage would likely lead to temporary spikes in global oil prices, potentially above $100 per barrel, due to supply disruptions and increased demand. · Disrupted Supply Chains:The Strait of Hormuz is a vital transit point for oil and LNG, and any disruption could cause significant delays and disruptions to global supply chains. · Higher Shipping Costs:With increased demand and reduced supply, shipping costs, including insurance premiums, would rise. · Energy Costs:Higher oil prices would translate to higher energy costs for consumers and businesses, impacting various sectors.  2. Long-term Impacts of the blockade of the Strait of Hormuz Main long-term effects of the blockage of the Strait of Hormuz are as follows:· Reduced Oil Production:Oil exporters might reduce production to conserve resources or diversify export routes, potentially leading to long-term supply shortages. · Economic Sanctions:In response to a blockade, major oil buyers might exert pressure on oil-producing states to increase supply, potentially leading to economic sanctions against Iran. · Diversification of Trade Routes:Oil-producing states and major oil importers might explore alternative trade routes to reduce reliance on the Strait of Hormuz, potentially shifting trade patterns. · Geopolitical Instability:The Strait of Hormuz is a strategic chokepoint, and any disruption could lead to increased geopolitical tensions and conflicts.  3. Overall Economic Consequence  Overall economic effects of the blockage of the Strait of Hormuz are as follows:· Increased inflation:Higher energy costs would contribute to inflation in various countries, impacting consumers and businesses.· Global economic slowdown:Disruptions to supply chains and increased costs could lead to a slowdown in global economic growth.· Regional economic instability:The Strait of Hormuz is a key economic artery for the Middle East, and any disruption could lead to significant economic instability in the region.  V. Analysis of Economic Effects of the Blockade of the Strait of Hormuz According to several Western banks, a complete closure of the Strait could cause crude Oil prices to soar above $120 to $150 a barrel, or even more if the conflict between Israel and Iran is prolonged. According to Deutsche Bank, the scenario of a total closure of the Strait, causing an interruption of 21 million barrels a day for two months, could push oil price to over $120 a barrel, or even beyond if global supplies are permanently disrupted. Analysts from Rabobank, a Dutch multinational banking and financial services company, even mention a spike towards $150 a barrel, recalling that in 2022, after Russia invaded Ukraine, the Brent crude oil price briefly touched $139. But the difference here is major: Persian Gulf oil is geographically concentrated and trapped in a single access point, they note. TD Securities, a Canadian multinational investment bank, points out that the oil market is currently in a situation of oversupply, but if the Strait of Hormuz are blocked, even temporarily, no production capacity - neither from OPEC nor the United States - can immediately compensate for a shortfall of 17 to 20 million barrels/day. According to analyses from these Western banks, consequences of the shutdown of the Strait of Hormuz are below: • Energy inflation: Crude oil and gas prices would soar, affecting household bills, industrial costs and overall inflation. An oil price surge above $120 would trigger a drop in global growth, similar to 1973, 1990 or 2022, claims Deutsche Bank. • Energy shock in Europe and Asia: Europe is still largely dependent on Qatari LNG, which transits through Hormuz. And for Asia, the closure of the Strait would be a major blow, particularly for China, India and South Korea, according to ING, a Dutch multinational banking and financial services corporation. • Disruption of supply chains: Beyond energy, Hormuz is also a key axis of global maritime trade. A prolonged closure would increase marine insurance premiums, impacting the prices of imported goods, and delaying many imports. According to JP Morgan, the situation remains fluid, and the magnitude of potential economic impact is uncertain. However, the impact is likely to be uneven globally.S&P Global projects substantial economic consequences across multiple regions if disruptions through the Strait of Hormuz take place:· Middle East: Direct production and export disruptions would immediately impact regional economies dependent on energy revenues.· Asia-Pacific: The region’s high energy dependency creates a multiplier effect, where initial price shocks trigger broader economic impacts.· Europe: While less directly dependent on Gulf oil than Asia, Europe would face secondary supply chain bottlenecks and inflationary pressures. The Asia-Pacific region faces severe vulnerability, with approximately 84% of its crude oil imports transiting through the Strait of Hormuz according to International Energy Agency data from 2025. This dependency creates a significant economic exposure that extends far beyond immediate energy price effects. For example, nearly 90% of Iran’s oil exports go to China. China has relatively diversified oil import sources and large reserves. However, markets such as India, South Korea, Japan, and Indonesia, which rely heavily on Middle Eastern oil, will be more vulnerable. Higher sustained oil prices would have far-reaching economic consequences in Asia, including China. India, South Korea, and Japan. Even China, with their high dependence on Middle Eastern oil, would see their inflation rates accelerate, their economic growth drop and the price of goods rise because of an increase in energy prices. If rising fuel costs continue, they could be even more devastating for emerging markets in Southeast Asia. Specifically, India is highly exposed to Middle East energy. More than 60% of its oil comes via Hormuz. A $10 hike in global crude will cuts India’s GDP growth by 0.3% and raises inflation by 0.4%, according to India’s Ministry of Finance. Shipping insurers have already raised premiums by 20%. Cargo rerouting around the Cape of Good Hope adds 15–20 days and significant costs. Indian refiners are holding prices for now, but margins are tightening. According to Brig Rakesh Bhatia, an India security expert, it’s not just about energy. India’s trade with Iran, especially Basmati rice exports worth ₹6,374 crore in FY 2024–25, faces disruption due to insurance issues and port uncertainty. According to Amitendu Palit, a Senior Research Fellow and Research Lead (trade and economics) in the Institute of South Asian Studies (ISAS) at the National University of Singapore, the impacts of closing of the Strait of Hormuz or its disruptions on India are below: •  India, which imports about two-thirds of its crude and nearly half of its LNG through the Strait of Hormuz, stands to lose significantly in case of disruption. A closure or disruption in the Strait of Hormuz would spell trouble for India. Nearly 70% of its crude oil and almost 40% of its LNG imports pass through this route, with Qatar alone supplying nearly 10 million tonnes of LNG in 2024. Any blockage could severely impact energy security and prices.• Energy prices: Surging oil and gas costs could spike domestic inflation, especially in transport and food.• Currency pressure: Rising import bills would widen the current account deficit and weaken the rupee.• Sectoral impact: Aviation, logistics, tyres, and manufacturing sectors could face cost surges.• Though India holds strategic oil reserves, experts caution these are built for short-term supply shocks—not sustained disruption from a regional war. According to Palit, the major impacts on India result from the escalation in crude oil prices. India is one of the largest importers of crude oil in the world after China, Europe and the United States (US). However, unlike China, which is the largest global buyer of Iranian crude oil, India’s main sources of crude oil are Iraq, Saudi Arabia and Russia, followed by the United Arab Emirates and the US. Crude oil price rises will impact India’s overall import bill. Though many Indian refiners have long-period forward contracts to purchase crude oil at previously agreed prices, future such contracts entered into now will have to factor in the prevailing higher prices. Needless to say, spot purchases of crude oil, based on immediate requirements, will be at much higher prices. Higher crude prices will impact domestic prices across the board. Refiners are unlikely to absorb these prices and will pass them on to consumers. Liquefied petroleum gas, diesel and kerosene – all of which are refined petroleum products for common household use, including by low-income families – will become costlier. The multiplier effects of higher prices will be noticeable as energy demand is high during peak summer. Higher prices will also be experienced by civil aviation. Air travel is set to become more expensive as aviation turbine fuel prices go up. Apart from domestic air travel, international air travel will also become costlier. Air India and other Indian carriers are already taking longer routes by avoiding the Pakistani airspace. Now, more international airlines, particularly the Middle Eastern carriers, will be rerouting their flights to avoid Israeli and Iranian airspace, leading to longer routes and higher prices. This is certainly not good news during the peak tourist season, with Indians travelling to the West, especially to holiday spots in Europe. Apart from flying costs, there are major disruptions for travel agents and tour planners as they will be forced to rework itineraries. Domestic inflation prospects in India will be aggravated by the sharp escalation in gold prices. Geopolitical volatility never fails to trigger the urge to invest in ‘safe havens’. The tendency is visible through a sharp rise in the prices of the US dollar, and gold and silver. Unless there is a quick resolution of the Iran conflict, precious metal prices will remain high into the festive season, which commences in India in about three months. Consumer pockets and household budgets will feel the squeeze from the cumulative higher costs. For much of India, high prices from exogenous shocks such as the Iran conflict, is clearly not great news in a year when the overall prospects for economic growth are more subdued than in the previous years Unlike India, China appears more insulated. China has been over-importing crude for months, building strategic reserves of more than 1 billion barrels. Its diversified supply lines from Russia, Venezuela, and the Gulf provide flexibility. However, China has significant Belt and Road investments in Iran and Iraq, including infrastructure and power plants, thereby damaging China. Taiwan Minister of Economic Affairs Kuo Jyh-huei estimated on 23 June 2025 that if Iran moves to block the Strait of Hormuz, it would cause crude oil prices to rise and subsequently impact Taiwan's fuel prices and consumer price index (CPI). Currently, less than 20 percent of Taiwan's crude oil and natural gas import pass through the Strait of Hormuz. If the strait were to be blocked, ships would be forced to take longer alternative routes, delaying deliveries, causing oil prices to rise, Kuo claims that a 10 percent increase in oil prices would raise the CPI by approximately 0.3 percent. The ripple effects are already hitting Southeast Asia. As Al Jazeera reports, energy-importing nations like Indonesia, Malaysia, and Vietnam are facing higher shipping costs and insurance surcharges. Bangladesh and Sri Lanka, already under economic strain, are especially vulnerable to energy supply delays and inflation. For Southeast Asia, this situation would result in escalating costs across various sectors. Energy-dependent industries, including manufacturing, transportation, and logistics, would face soaring operational expenses, which could reduce output and increase consumer prices. The manufacturing sector in Southeast Asia, a pivotal component of regional economic growth, would be particularly adversely affected by rising fuel costs, thereby diminishing its competitiveness in the global market. Additionally, inflationary pressures would undermine consumer purchasing power, dampening domestic consumption and subsequently slowing GDP growth throughout the region.  Iran itself would not escape unscathed. Closing the Strait would choke its own oil exports, which account for 65% of government revenue, risking economic collapse and domestic unrest for Iran. On the other hand, Europe’s demand for LNG has increased since the Russia-Ukraine Conflict, although reliance on the Middle East has fallen as Europe imported more from U.S. However, Europe remains highly sensitive to energy prices. Conversely, the U.S., as a net energy exporter, could be less impacted compared to previous oil crises when it relied more on oil imports. However, the U.S. is entering this period from a vulnerable state of increasing risks of inflation and an economic slowdown. It is estimated that a USD 10 increase in oil prices could add 0.3-0.4% to inflation, exacerbating current stagflationary risks given the surge in tariffs. This also complicates the Federal Reserve's (Fed) decision-making. Economic experts still expect the Fed to be slow to cut interest rates, as inflation risks remain larger than unemployment concerns for now.  VI. Conclusion This paper showed that the blockage of the Strait of Hormuz will increase oil & other energy prices, inflation, and shipping costs, while it reduces economic growth in the world. This paper claimed that these negative impacts will be largest in Asian countries because 84% of the crude oil and condensate and 83% of the liquefied natural gas that transported through the Strait of Hormuz went to Asian markets in 2024.

Energy & Economics
Chinese yuan on the map of South America. Trading between China and Latin American countries, economy and investment

China-Latin America Green Cooperation and the Global Development Initiative

by Cao Ting

한국어로 읽기 Leer en español In Deutsch lesen Gap اقرأ بالعربية Lire en français Читать на русском Abstract The global development initiative proposed by China aims to promote global sustainable development and has received support from many Latin American countries. At present, green cooperation between China and Latin America has achieved positive results in multiple fields such as clean energy, green agriculture, and green transportation. Latin American countries can become important partners for China to promote the Global Development Initiatives. However, in terms of green cooperation, China and Latin America also face some challenges. Both sides must strengthen consensus and achieve coordinated development in various fields. Sustainable Development and the Global Development Initiative The current international situation is turbulent and constantly changing, with a global economy that remains stagnant, while challenges such as geopolitical conflicts, climate change, and the food crisis are becoming increasingly intertwined and exacerbated. In this context, all countries around the world face the important task of promoting sustainable development and maintaining healthy economic and social growth. On September 21, 2021, Chinese President Xi Jinping officially launched the Global Development Initiative at the United Nations, outlining a path toward a new stage of global development that is balanced, coordinated, and inclusive (Ministry of Foreign Affairs of China, 2021). The Global Development Initiative is aligned with the 2030 United Nations Sustainable Development Goals and places climate change and sustainable development as key areas of cooperation, emphasizing the idea of harmonious coexistence between humanity and nature. Its goal is to promote stronger, more sustainable, and healthier global development, and to build a global community for development. The 33 countries of Latin America and the Caribbean are a fundamental part of the Global South and, in general, place great importance on sustainable development, which has allowed them to achieve notable successes in the field of sustainable cooperation. In a context of great power competition and ongoing regional conflicts, the strengthening of sustainable cooperation between China and Latin American countries presents numerous opportunities, creating ample space to jointly advance in sustainable development. The concept of a sustainable economy evolved from the idea of sustainable development, with harmony between humanity and nature at its core and the goal of achieving long-term sustainability. This approach maintains that economic growth is not an unlimited or uncontrolled process but rather must be conditioned by the ecological environment’s capacities and the resource carrying capacity. The concept of a sustainable economy emerged in the late 1980s when British environmental economist David Pearce introduced it in his work “Blueprint for a Green Economy”, published in 1989. However, it was not until the United Nations Conference on Sustainable Development, held in Rio de Janeiro in 2012, that the sustainable economy began to receive greater attention and became a central concept in global development strategies. According to the United Nations Environment Programme (UNEP), a sustainable economy is driven by public and private investments that reduce carbon emissions and pollution, improve energy and resource efficiency, and prevent the loss of biodiversity and ecosystems. A sustainable economy has always promoted development goals that integrate economic, social, and environmental aspects. This respect for the environment and nature is closely linked to traditional Chinese worldviews. Since ancient times, the Chinese have developed ideas about following the laws of nature and protecting the ecological environment. In the classical text “Yi Zhou Shu Ju Pian”, it is recorded: "During the three months of spring, no axes are used in the mountains and forests, to allow plants to grow; during the three months of summer, no nets are placed in rivers and lakes." These ideas have been a fundamental part of the spiritual thought and culture of the Chinese people for over five thousand years, and through them, they have envisioned humanity and nature as an organic and indivisible whole. They represent the basic understanding of the relationship between humans and nature in ancient Chinese agricultural society, where coexistence and mutual promotion between people and the ecological environment reflected a dialectical relationship of unity. These ideas, full of deep wisdom, constitute an essential component of China’s rich cultural tradition. Consensus Base for Green Cooperation In 2021, the Global Development Initiative, aligned with the United Nations Sustainable Development Agenda, established eight key areas of cooperation: poverty reduction, food security, industrialization, connectivity, pandemic response, development financing, climate change, and the digital economy. It also proposed key principles such as “prioritizing development,” “people-centered focus,” “universal inclusion,” “innovation-driven efforts,” “harmony between humanity and nature,” and “action-oriented approaches.” Latin American countries also place great importance on sustainable development and share numerous points of consensus with China on these principles. Currently, several countries in the region, including Peru and Colombia, have joined the “Group of Friends of the Global Development Initiative.” This shared commitment to sustainable development between China and Latin America provides an important foundation for advancing sustainable cooperation. Particularly, China and Latin American countries have broad consensus in the following areas: 1. Prioritizing national development. Both China and many Latin American countries are developing nations and consider the promotion of sustainable development a crucial goal. President Xi Jinping emphasized in the report presented at the 19th National Congress of the Communist Party of China (CPC): “The fundamental fact that our country is still and will long remain in the primary stage of socialism has not changed; our international status as the largest developing country in the world has not changed.” (Xi, 2017) China’s fundamental national situation determines that its main task is to advance along the path of socialism with Chinese characteristics and to focus its efforts on socialist construction. The Global Development Initiative also highlights “prioritizing development” as one of its core pillars. Latin America, for its part, faces the challenge of progressing in development. Although it was one of the regions in the Global South to achieve national independence and begin economic development relatively early, some Latin American countries have experienced stagnation in their economic transformation and have not managed to overcome the so-called “middle-income trap.” Affected by factors such as low global economic growth, fiscal constraints, and limited policy space, Latin America’s economy has shown a weak recovery in recent years, with some countries facing serious inflation and debt problems. Therefore, promoting sustainable development has become a top priority for governments in the region. In 2016, Latin American countries promoted the creation of the Forum of the Countries of Latin America and the Caribbean on Sustainable Development, as a regional mechanism for implementing the 2030 Agenda for Sustainable Development (ECLAC, 2016). By the end of 2023, six successful conferences had been held, and the Latin America and the Caribbean Sustainable Development Report had been published annually to assess the region’s progress in meeting the Sustainable Development Goals (SDGs). 2. Addressing welfare issues as a central task Since the 18th National Congress of the CPC, the Party’s central leadership, led by Xi Jinping, has promoted a people-centered development approach, insisting that everything should be done for the people and depend on the people, always placing them in the highest position. During the centennial celebration of the CPC’s founding, General Secretary Xi emphasized: “To learn from history and forge the future, we must unite and lead the Chinese people in a tireless struggle for a better life.” In contrast, Latin America is one of the most unequal regions in the world. The unequal distribution of wealth, along with gender and racial discrimination, are persistent issues that have been worsened by the COVID-19 pandemic and the global economic slowdown. According to data from the Economic Commission for Latin America and the Caribbean (ECLAC), in 2023 the region’s poverty rate was 29.1%, and extreme poverty was 11.4%, both slightly higher than in 2022 (29% and 11.2%, respectively) (France24, 2023). As a response, many Latin American governments — such as those in Brazil, Mexico, Chile, and Cuba — have incorporated attention to welfare issues and improving their citizens’ quality of life as key pillars in their public policy agendas. 3. Embracing inclusion and shared benefits as a guiding principle Following the end of the Cold War, the world experienced a trend toward multipolarity and continued economic globalization. However, in recent years, there has been a resurgence of protectionism in various forms, accompanied by a rise in unilateralism and hegemonic policies. These “deglobalization” practices not only fail to resolve internal problems, but also disrupt global supply chains, hinder healthy economic development, and harm the interests of countries. In response, developing nations such as China and Latin American countries advocate for multipolar development and oppose unilateralism and power politics. In December 2023, China’s Central Conference on Foreign Affairs Work emphasized the importance of inclusive and mutually beneficial economic globalization. Similarly, Latin America has maintained a diversified foreign policy and has worked toward building a new, fair, and equitable international political and economic order. Amid rising tensions among major powers, most Latin American countries have chosen not to take sides, maintaining a non-aligned policy. Moreover, countries in Latin America are increasingly focused on inclusive development both within their nations and across the region, striving to address internal development imbalances. In 2010, the Andean Development Corporation (predecessor to the Development Bank of Latin America and the Caribbean) released the “Latin America Vision Plan 2040”, which highlighted the need to strengthen economic inclusion in order to achieve truly sustainable growth (CAF, 2010). In January 2023, the Community of Latin American and Caribbean States (CELAC) Summit in Argentina approved the “Buenos Aires Declaration,” which stressed the importance of promoting inclusive development in the region and fostering inclusive dialogue with other regions (CELAC, 2023). 4. Embracing innovation as a key driver Marx pointed out that “science is also part of the productive forces” and that “the development of fixed capital shows the extent to which the general knowledge of society has become a direct productive force.” In 1988, at the National Science Conference, Deng Xiaoping declared, “science and technology are the primary productive forces.” Since the 18th CPC Congress, China has firmly pursued innovation-led development. It launched the National Innovation-Driven Development Strategy, issued the Medium- to Long-Term Science and Technology Development Plan (2021–2035), and rolled out the Technological Innovation Blueprint under the 14th Five-Year Plan. Thanks to this framework, China has made significant progress in accelerating emerging technologies such as artificial intelligence, big data, quantum communication, and blockchain. Latin American countries are also intensifying their focus on technological innovation. In 2023, CELAC’s Buenos Aires Declaration underscored the importance of innovation for enhancing regional competitiveness and job quality, while encouraging scientific exchanges among nations and subregional organizations. Furthermore, the President of Brazil, Luiz Inácio Lula da Silva, committed to increasing investment in technological development. To that end, he announced at the 28th Conference of the Parties to the United Nations Framework Convention on Climate Change an investment of approximately 21 billion reais (around 4.28 billion U.S. dollars) in sustainable economy, innovative technologies, and low-carbon economy. In the 2023 Global Innovation Index, Brazil ranked 49th out of 132 countries, improving by five positions compared to the previous year. The President of Chile, Gabriel Boric, pledged to increase public funding for research and to finance the work of universities and research institutions. In 2019, the Colombian government established the “International Mission of Wise People,” a body composed of 46 national and international academic experts to promote production diversification and automation, with the goal of doubling the share of manufacturing and agriculture in the country’s Gross Domestic Product (GDP) by 2030. The current president of Colombia, Gustavo Petro, has committed to transforming the country into a “knowledge society” and to continuing this initiative. 5. Making harmony between humans and nature a central goal Developing countries — including China and Latin American nations — prioritize climate issues and actively contribute to global climate governance. Since ancient China during the Spring and Autumn and Warring States periods, philosophical schools such as Confucianism and Taoism had already proposed concepts about the “unity between Heaven and humankind.” Similarly, Indigenous cultures in Latin America also share related cultural traditions. The Quechua peoples of Peru, Ecuador, and Bolivia promote the concept of “’Buen Vivir’” (“Good Living”), which emphasizes harmony between human society and nature. The Aymara of Peru and Bolivia, the Guaraní of Brazil, Argentina, Paraguay, and Bolivia, the Shuar of Ecuador, and the Mapuche of Chile all have similar philosophical expressions. So far in the 21st century, China and Latin American countries have intensified their focus on sustainable development. In August 2005, during a visit to Anji in China’s Zhejiang Province, Xi Jinping, then Secretary of the Communist Party of China in Zhejiang, put forward the principle that “lucid waters and lush mountains are as valuable as mountains of gold and silver,” highlighting the idea that economic growth should not be achieved at the expense of the environment. China’s Global Development Initiative includes climate change and sustainable development as key cooperation areas, aiming for stronger, healthier global progress. Simultaneously, Latin American countries value sustainability highly. Ten nations in the region have officially submitted carbon-neutrality timelines and developed emissions-reduction plans. Several governments have taken significant measures to accelerate energy transition, restore ecosystems, and enhance international cooperation. Notably, Brazil, Chile, Costa Rica, and Uruguay have made substantial strides in renewable energy: in Q1 2023, more than 90 % of Brazil’s energy came from renewables — the highest level since 2011. Progress of Green Cooperation between China and Latin America 1. High-level design for sustainable cooperation between China and Latin American countries has been continuously strengthenedAs comprehensive cooperation between China and Latin America progresses, sustainable collaboration has also become integrated into the strategic high-level planning. At the third Ministerial Meeting of the China-CELAC Forum in 2021, the "Joint Action Plan for Cooperation in Key Areas between China and CELAC Member States (2022–2024)" was adopted. This plan emphasizes the continuation of cooperation in areas such as renewable energy, new energy, civil nuclear energy, energy technology equipment, electric vehicles and their components, as well as energy-related geological and mineral resources. It also outlines the expansion of cooperation in emerging industries related to clean energy resources, support for technology transfer between companies, and the respect and protection of the natural environment. Joint declarations between China and countries such as Brazil, Mexico, and Argentina on establishing and deepening comprehensive strategic partnerships mention strengthening cooperation in areas such as climate change and clean energy. During the sixth meeting of the Sino-Brazilian High-Level Commission for Coordination and Cooperation in May 2022, the Chinese Ministry of Commerce and the Brazilian Ministry of Economy agreed to sign a Memorandum of Understanding on Promoting Investment Cooperation for Sustainable Development, aimed at promoting investment in clean and low-carbon technologies in both countries. In April 2023, during Brazilian President Luiz Inácio Lula da Silva's visit to China, the two countries issued the “China-Brazil Joint Declaration on Combating Climate Change” and signed several cooperation agreements related to the sustainable economy. For example, Article 3 mentions “expanding cooperation in new fields such as environmental protection, combating climate change, the low-carbon economy, and the digital economy,” while Article 10 notes the aim to “strengthen cooperation on environmental protection, climate change, and biodiversity loss, promote sustainable development, and accelerate the transition to a low-carbon economy.” In the same month, the “China-Brazil Joint Declaration on Combating Climate Change,” the “Memorandum of Understanding on Research and Innovation Cooperation between the Ministries of Science and Technology of China and Brazil,” and the “Memorandum of Understanding on Promoting Investment and Industrial Cooperation between China and Brazil” identified key areas of future cooperation, including sustainable infrastructure, the development of sustainable industries, renewable energy, electric vehicles, sustainable technological innovation, and green financing. 2. Clean energy cooperation has deepened The development and use of clean energy are essential means for achieving green development. In recent years, clean energy cooperation between China and Latin America has shown the following main characteristics. The scope of clean energy cooperation is becoming increasingly broad. Currently, cooperation between China and Latin America in the fields of clean energy — such as hydropower, solar energy, wind power, nuclear energy, biomass energy, and lithium batteries — has reached a certain level of breadth and depth. At the same time, both sides have also initiated cooperation efforts in emerging areas such as green hydrogen and smart energy storage. China is constantly diversifying its target countries and modes of investment in clean energy in Latin America. In 2015, China began increasing its investment in the renewable energy sector in the region. Between 2005 and 2020, China’s main investment targets in renewable energy in Latin America included countries such as Brazil, Mexico, Peru, Argentina, and Bolivia. Investments in projects, mergers and acquisitions, and greenfield investments have gone hand in hand. 3. Green cooperation in the transportation sector has yielded outstanding results. Chinese companies continue to cooperate with Latin American countries in the field of public transportation infrastructure and electric vehicles, promoting the low-carbon development of the transport sector in Latin America. First, cooperation in public transportation infrastructure is advancing. In recent years, Chinese companies have actively participated in the construction of public infrastructure such as railways, roads, and bridges in Latin American countries, aiming to promote interconnectivity and green travel across the region. Bogotá Metro Line 1, in the capital of Colombia, currently under construction with Chinese investment, is to date the largest public-private partnership (PPP) project in individual transportation infrastructure in Latin America. Second, trade in electric vehicles is developing rapidly. China’s electric vehicle industry has extensive experience in large-scale production and a relatively complete industrial supply chain, making it a new growth area in China–Latin America trade. Electric buses and cars from independent Chinese brands such as BYD, JAC, and Dongfeng are favored in Latin America due to their good quality and low price. Third, cooperation in battery and tram production is also improving. China and Latin America have also begun bold attempts in green capacity cooperation within the manufacturing sector. Currently, BYD is carrying out a range of production activities in Brazil, including the assembly of bus chassis and the production of photovoltaic modules and batteries. 4. Green agricultural cooperation is on the rise. Latin America has vast and fertile land, and agricultural cooperation is an important component of China–Latin America trade. In recent years, Chinese companies have paid increasing attention to using advanced technologies to strengthen environmental protection and actively promote the green transformation of agricultural cooperation. COFCO (‘China National Cereal, Oil & Foodstuff Corporation’) and its Brazilian partners conducted risk assessments of more than 1,700 soybean suppliers in the Amazon and Cerrado ecological zones, and mapped over 1.1 million hectares of soybean fields using remote sensing satellites, which has raised farmers' awareness of sustainable development. By the end of 2021, COFCO had achieved 100% traceability for all direct soybean purchases in Matopiba, a major soybean-producing region in Brazil. At the same time, China and several Latin American countries are promoting cooperation in green agricultural research and development. The Chinese Academy of Tropical Agricultural Sciences has established cooperative relationships with nine Latin American countries, including Colombia, Panama, Ecuador, and Costa Rica. It has achieved progress in exchange and cooperation in areas such as the innovative use and protection of germplasm resources, efficient transformation and comprehensive utilization of biomass energy, green pest and disease prevention and control technologies, and efficient cultivation techniques. 5. Cooperation on green financing plays an important bridging role. The Global Development and South-South Cooperation Fund and the China-United Nations Peace and Development Fund are key financial platforms through which China supports project cooperation under the Global Development Initiative. In addition to the above-mentioned platforms, current green financial instruments between China and Latin America include the Asian Infrastructure Investment Bank, the China–Latin America Cooperation Fund, the China–Latin America Development Finance Cooperation Mechanism, and subsidies provided by China’s Ministry of Commerce and Ministry of Foreign Affairs. Currently, all three financing projects of the Asian Infrastructure Investment Bank in Brazil are related to the green economy. Challenges facing Sino–Latin American green cooperation Although green cooperation between China and Latin America has gradually achieved results and presents many development opportunities, the risks and challenges of cooperation should not be ignored. Most Latin Americans expect that foreign cooperation will promote social well-being, eliminate poverty, and reduce inequality in their countries. They place great importance on the social benefits of projects and pay close attention to the environmental impact of projects on local ecosystems. Currently, the process of extracting lithium from brine places high demands on water resources and carries the risk of air and water pollution. As a result, lithium mining has also faced opposition from Indigenous communities in some Latin American countries. In 2023, Indigenous peoples from Argentina’s Jujuy Province staged several protests against the exploitation of a lithium mine (Reventós, 2023). To reduce pollution in lithium extraction, further scientific and technological research is needed. The integration of Chinese companies into Latin America also faces many obstacles. The official languages of most Latin American countries are Spanish and Portuguese, which are deeply influenced by European and U.S. cultures. In addition to geographical distance, there is limited mutual understanding between the peoples of China and Latin America, and transportation and logistics costs are high. Most Chinese companies lack personnel fluent in Spanish or Portuguese and familiar with local laws and regulations. Currently, the U.S. government continues to view China as a strategic competitor. Latin America has also become a battleground for strategic competition between China and the United States. The U.S. has increasingly turned its attention to China’s cooperation with Latin American countries. In 2019, the U.S. House Committee on Foreign Affairs published an article stating that “China’s green investment in Latin America cannot offset local environmental damage” (Cote-Muñoz, 2019). In general, green cooperation between China and Latin America will face a more complex environment in the future. Final considerations In recent years, China has put forward the Global Development Initiative to promote international cooperation for sustainable development. Latin America, one of the regions with the most developing countries in the world, actively promotes the implementation of the Sustainable Development Agenda and has a solid green economic foundation. In this sense, the region can be an important partner for China in achieving the goals of the 2030 Agenda and building a shared future for humanity. China must continue to build consensus on development priorities with Latin American countries, plan key areas of cooperation according to their conditions and needs, promote connections between governments, businesses, universities, and media in China and Latin America, and jointly advance the green cooperation to a new level. China and Latin America have achieved multidisciplinary coverage in green cooperation. It is necessary to further improve the quality of cooperation in the future and achieve coordinated development across various sectors. For example, in the long term, the development of renewable energy will require greater energy storage capacity and wider electric grid coverage. Additionally, Chinese companies need to integrate more into local societies and generate greater social benefits while ensuring economic returns. They can strengthen cooperation with Latin American companies in order to quickly become familiar with local laws, regulations, and market conditions. Furthermore, more research — including environmental assessments and social consultations — should be conducted before launching projects. References CAF (2010). "Corporación Andina de Fomento, Visión para América Latina 2040 Hacia una sociedad más incluyente y próspera". https://scioteca.caf.com/bitstream/handle/123456789/496/latinamerica_2040_summary_esp.pdf?sequence=1&isAllowed=yCELAC (2023). "Declaración de Buenos Aires". https://www.cancilleria.gob.ar/userfiles/prensa/declaracion_ de_buenos_aires_-_version_final.pdf CEPAL (2016). "El Foro de los Países de América Latina y el Caribe sobre el Desarrollo Sostenible y el Seguimiento Regional de la Agenda 2030". https://www.cepal.org/es/temas/agenda-2030-desarrollo-sostenible/ foro-paises-america-latina-caribe-desarrollo-sostenible-seguimiento-regional-la-agenda-2030Cote-Muñoz, N. (2019). "China's Green Investments Won't Undo Its Environmental Damage to Latin America". Council on Foreign Relations. https://www.cfr.org/blog/chinas-green-investments-wont-undo-its-environmental-damage-latin-americaFrance24 (2023). "Tasa de pobreza se mantiene en 29 % en América Latina en 2023". https://www.france24.com/es/minuto-a-minuto/20231125-tasa-de-pobreza-se-mantiene-en-29-en-am%C3%A9rica-latina-en-2023-dice-cepalMinistry of Foreign Affairs of China (2021). "Global Development Initiative-Building on 2030 SDGs for Stronger, Greener and Healthier Global Development". https://www.mfa.gov.cn/eng/zy/jj/GDI_140002/wj/202406/ P020240606606193448267.pdfReventós, B. y N. Fabre (2023). "Los grupos indígenas en Argentina que se oponen a la extracción del litio". BBC. https://www.bbc.com/mundo/articles/cevzgv0elp9o Cuadernos de Nuestra América. No. 014 | Nueva Época 2025, Centro de Investigaciones de Política Internacional (CIPI). Under CC BY-NC 4.0

Energy & Economics
Chinese yuan Renminbi money rolls 3d illustration. Camera over the RMB rolling banknotes. Concept of economy, crisis, finance, cash, business and recession in China.

Understanding China’s Renminbi Strategy: Strategic Integration over Monetary Supremacy

by Monique Taylor

한국어로 읽기 Leer en español In Deutsch lesen Gap اقرأ بالعربية Lire en français Читать на русском China’s strategy to internationalise the renminbi (RMB) is about building resilience and influence through selective, state-managed global integration. Beijing is not seeking to elevate the RMB to the status of a global reserve currency on par with the dollar, nor is the strategy solely about insulating China from the geopolitical risks of dollar dependence, although this is an important component. Rather, it represents a pragmatic response to an increasingly fragmented global economy—one marked by rising geopolitical tensions, growing weaponisation of the dollar, and accelerating financial and technological innovation. China is pursuing a targeted, state-managed form of internationalisation that involves building an alternative web of financial relationships and infrastructures facilitating transactions outside the US-dominated system. These include currency swap lines with strategic partners, the establishment of RMB clearing banks, bilateral trade settlement mechanisms, and payment infrastructures such as the Cross-Border Interbank Payment System (CIPS), which serves as a partial alternative to SWIFT. While these efforts help reduce exposure to potential disruptions from dollar weaponisation, they are part of a broader strategy to embed the RMB in key transactional domains like trade, investment, and energy. In these spheres, China seeks to expand its influence and establish rules and mechanisms conducive to its own strategic and financial interests. Building functional alternatives to the US dollar China’s RMB internationalisation strategy is multi-layered, spanning bilateral currency swaps, RMB clearing arrangements, development finance, and payment system alternatives. Instruments such as RMB-denominated oil trades (referred to as the “petroyuan”) and the digital yuan illustrate this approach. The petroyuan enables sanctioned countries like Russia and Iran to settle oil trades in RMB, while China’s growing financial ties with Gulf states suggest that broader adoption may follow. Similarly, the digital yuan, though originally intended primarily for domestic use, is now being piloted for cross-border transactions, potentially laying the groundwork for an international digital payments network. Technological innovations are facilitating this shift by enabling the creation of central bank digital currencies, alternative financial messaging systems, and blockchain-based settlement tools—all of which can support secure transactions that operate outside traditional dollar-clearing infrastructure. In the long run, such developments could gradually reduce global reliance on the dollar. These initiatives are less about achieving global reach and more about securing strategic autonomy and expanding influence in key domains. China’s aim is to reduce vulnerability to US sanctions and dollar volatility, while gradually expanding the RMB’s role in trade, energy, and infrastructure finance, especially in the Global South, where demand for alternatives is growing. BRICS+, the BRI, and the strategic reach of the RMB Platforms like the Belt and Road Initiative (BRI) and BRICS+ play an important role in China’s RMB internationalisation strategy. They provide the geopolitical and institutional scaffolding for RMB usage in trade and investment, particularly in politically aligned or dollar-constrained contexts. For instance, RMB settlements with BRI countries reached 5.42 trillion yuan in 2021, and China has concluded dozens of currency swap agreements with its partners. While the lion’s share of these transactions is still conducted in US dollars, RMB usage is growing steadily. These arrangements point to a shift toward a multipolar and domain-specific currency landscape—one where the RMB gains traction in selected spheres, even if it remains marginal in global reserves and FX markets. Currency swap agreements, RMB clearing banks, and trade invoicing in local currency are all being promoted among China’s partners, especially those looking to reduce reliance on Western financial systems. The result is a modest but growing network of RMB-based interaction shaped by political alignment and strategic institutional design, rather than spontaneous market demand. While dollar dominance persists, de-dollarisation gains momentum The US dollar still dominates global finance. It accounts for nearly 90 percent of FX transactions and more than half of global reserves. However, that dominance increasingly rests on geopolitical foundations that are showing signs of strain. Trump 2.0’s chaotic tariffs combined with the US’s aggressive use of financial sanctions in recent years have made allies and adversaries alike question the long-term reliability of the dollar-based system. For countries exposed to US foreign and economic policy swings, whether through sanctions, interest rate volatility, or trade frictions, China’s RMB-based alternatives offer a way to diversify. In this sense, de-dollarisation is not a revolution but a structural recalibration: a rebalancing of risk rather than a zero-sum rivalry with the dollar. What China offers is not a wholesale exit from the dollar system, but an incremental hedge—a monetary space in which RMB-denominated transactions gain traction in contexts where diversification and reducing dollar dependence are prioritised. This logic underpins a broader push within the BRICS+ grouping to reduce reliance on the dollar in trade and finance. The group has floated proposals for a shared reserve currency, possibly backed by a basket of member currencies or commodities like gold, as part of its effort to foster a more multipolar monetary system. While such proposals face significant practical challenges, they reflect a clear political intent to diversify away from dollar-dominated structures. China plays a central role in these efforts, not by promoting the RMB as a global hegemonic currency, but by embedding it in alternative financial arrangements. In doing so, China contributes to a monetary order where the dollar remains dominant but increasingly contested. Why RMB leadership is not only unlikely but unnecessary Despite growing cross-border use of the RMB, significant structural constraints remain. China’s capital account remains closed, its financial markets lack transparency and depth, and its central bank operates under the authority of the party-state and, as such, lacks institutional independence. Unlike the US, which issues dollars globally through persistent trade and capital account deficits, China runs a trade surplus. This further limits the global supply of RMB and restricts its viability as a reserve currency. Central banks are unlikely to adopt the RMB as a core reserve asset under such conditions, and China has little interest in changing that right now—Beijing’s RMB internationalisation strategy is designed to work within, not against, these constraints. Indeed, the party-state’s emphasis on control and stability sits uneasily with the financial liberalisation required for global monetary leadership. In Beijing’s view, this is not a contradiction. The goal is not to supplant the dollar, but to achieve selective integration: a system in which China and its partners can transact securely, predictably, and independently of Western pressure. This approach enables China to expand its influence within specific domains, without challenging the broader dollar-centric monetary order. Adapting to a divided global economy RMB internationalisation is neither a bid for currency supremacy nor a mere act of self-defence. It is a tool of pragmatic adaptation—part of China’s effort to build resilience and exert influence through selective financial integration and institutional alternatives. As the world moves further into geopolitical and economic uncertainty, especially with the return of a Trump administration bent on upending the global trade system, China’s efforts may accelerate. The RMB won’t displace the dollar anytime soon, but its growing role in alternative trade, finance, and payment systems signals the slow but significant emergence of a more layered, fragmented, and contested global monetary order. This work has received funding from the European Union’s Horizon Europe coordination and support action 101079069–EUVIP–HORIZON-WIDERA-2021-ACCESS-03. Views and opinions expressed are however those of the author(s) only and do not necessarily re ect those of the European Union or the European Research Executive Agency (REA). Neither the European Union nor the granting authority can be held responsible for them. This article is published under a Creative Commons License and may be republished with attribution.

Energy & Economics
 March 28, 2018, the US and Chinese flags and texts at a studio in Seoul, Korea. An illustrative editorial. trade war

International trade war - Spice Road against Silk Road

by Joon Seok Oh

한국어로 읽기 Leer en español In Deutsch lesen Gap اقرأ بالعربية Lire en français Читать на русском AbstractPurpose The purpose of this paper is to analyse the international political economy of Korea and its effects due to geopolitical tension between China and the USA. Design/methodology/approach Economic war between China and the USA has prolonged longer than expected. Aftermath of the COVID-19 pandemic, reforming the supply chain has been the centre of economic tension between China and the USA. Quite recently, with the rapid expansion of Chinese e-commerce platforms, distribution channels come upon a new economic tension between the two. And now is the time to pivot its pattern of conflict from competition into cooperation. In this end, economic diplomacy could be a useful means to give a signal of cooperation. From the view of economic diplomacy, this paper tries to analyse the projected transition of economic war between China and the USA with its implication on the trade policy of Korea. Findings As an implementation of economic diplomacy, China suggested the Belt and Road Initiative (BRI), enhancing trade logistics among related countries to gain competitiveness. In 2023, the Biden administration suggested the India-Middle East and Europe Economic Corridor as a counter to BRI, which will be a threshold for changing trade policy from economic war into economic diplomacy. As a result, it is expected China and the USA will expand their economic diplomacy in a way to promote economic cooperation among allied states, while the distribution channel war would continue to accelerate the economic tension between China and the USA. Korea has to prepare for and provide measures handling this geopolitical location in its trade policy or economic diplomacy. Originality/value This research contributes to the awareness and understanding of trade environments from the perspective of economic diplomacy. 1. Introduction The advent of globalisation has led to widespread economic integration, creating global production networks and markets. However, the COVID-19 pandemic has acted as a significant setback to this trend. In the wake of COVID-19, an economic war has arisen between China and the USA, centred on the restructuring of global supply chains following widespread disruptions. International political economy (IPE) examines the power dynamics between states and the structures of influence within regional economies. Consequently, economic diplomacy has gained unprecedented attention. Economic diplomacy focuses on government actions regarding international economic issues, distinct from political diplomacy through its market-oriented approach in foreign policy. Putnam (1988) categorises economic diplomacy into two levels: unilateralism and bilateralism. Unilateral economic diplomacy (or unilateralism) often relies on hard power, involving decisions on trade liberalisation or market protection without negotiation. Bilateral economic diplomacy (or bilateralism) or multilateral economic diplomacy (or multilateralism), by contrast, involves negotiation among trade partners, resulting in agreements such as regional or global free trade agreements (FTAs). A vast range of state or non-state actors engage in economic diplomacy, navigating the complex interplay between international and domestic factors. Defining economic diplomacy is extremely challenging, but one useful definition is “the broad concept of economic statecraft, where economic measures are taken in the pursuit of political goals, including punitive actions such as sanctions” (Blanchard and Ripsman, 2008).  Figure 1 Recent trend of economic diplomacy To exert influence internationally, ministers and heads of government strive to demonstrate their capacity for national security through two primary approaches, as shown in Figure 1 (above): economic war (or competition) and economic diplomacy (or international cooperation). In the context of global supply chain restructuring, the economic conflict between China and the USA has intensified, marked by threats of supply chain disruptions. This has led to emerging strategies aimed at “crowding out” the USA from global supply chains (去美戰略) or excluding China through alliances such as the Allied Supply Chain and Chip 4. While economic war is inherently “temporary” due to its painstaking nature, economic diplomacy or international cooperation offer a more “long-term” approach because it is gains-taking. This paper analyses the factors contributing to the prolonged nature of this economic war and explores potential outcomes of the supply chain tensions between China and the USA from the perspectives of IPE or geo-economics. In conclusion, it highlights the importance of preparing for trade policy adjustments and strategic economic diplomacy. 2. International trade war and strategic items2.1 Supply chain The supply chain encompasses a network of interconnected suppliers involved in each stage of production, from raw materials and components to the finished goods or services. This network can include vendors, warehouses, retailers, freight stations and distribution centres. Effective supply chain management is a “crucial process because an optimised supply chain results in lower costs and a more efficient production cycle” [1]. Within the supply chain, a leading company typically holds governance power, enabling it to coordinate scheduling and exercise control across the interconnected suppliers, resulting in reduced costs and shorter production times (Gereffi et al., 2005) [2]. Since the 2000s, forward and backward integration have been key strategies for managing time, cost and uncertainty in supply chains. For example, Toyota’s Just-In-Time (JIT) system demonstrated the efficiency of locally concentrated supply chains until disruptions from the 2011 East Japan Earthquake and the Thailand flood. Following supply chain shutdowns in 2020, many businesses shifted from local to global supply chains, utilising advancements of the information technology (IT) and transportation technologies to geographically diversify operations. As the need for a systematically functioning global supply chain has grown, a leading nation, much like a leading company, often assumes governance power in international trade and investment, as illustrated in Figure 2 (below), by aligning with the leadership of a dominant market competitiveness, which makes this leadership valuable.  Figure 2 Supply chain The COVID-19 pandemic dealt a severe blow to the global supply chain, causing sudden lockdowns that led to widespread supply chain disruptions. To mitigate the risks of future global disruptions, supply chains have begun restructuring to operate on a more regionally segmented basis. In this shift toward regional supply chains, China and the USA are at the centre, drawing allied countries within their spheres of influence. This alignment helps explain why the economic war between China and the USA has lasted longer than anticipated. 2.2 Strategic items China has restricted exports of two rare metals, gallium and germanium, which are critical to semiconductor production. Kraljic (1983) highlighted the importance of managing “strategic items” within the framework of supply chain management, as shown in Figure 3. Kraljic emphasises the need to strengthen and diversify critical items. The Kraljic matrix provides a valuable tool for identifying essential items that require focused management within the supply chain.  Figure 3 Kraljic matrix Kraljic identified the importance of managing “bottleneck items” in strategic supply chain management – items that present high supply risk but have relatively low business value. Due to the potential costs associated with non-delivery or compromised quality of strategic items, these must be closely monitored and controlled. From a risk management perspective, establishing medium-term business relationships and collaboration with suppliers is essential. For example, South Korea imports over 90% of its urea for agricultural and industrial purposes from China [3]. Heavily dependent on China for urea supplies due to pricing factors, Korea faced challenges when China imposed export controls on urea, underscoring Korea’s vulnerability within China’s sphere of influence. The European Union (EU) also faces challenges with critical raw materials (CRMs). China remains the EU’s sole supplier of processed rare earth elements, while Chile supplies 79% of its lithium. In response, the EU introduced the CRM Act (CRMA) to support projects aimed at increasing “the EU’s capacity to extract, process, and recycle strategic raw materials and diversify supplies from the third countries” [4]. 2.3 Resilient supply chain alliance In contrast to China’s approach of leveraging supply disruptions to strengthen its influence, the Biden administration in the USA has adopted a cooperative approach focused on building resilient supply chains (Pillar 2) through the Indo-Pacific Economic Framework (IPEF), which includes 14 member countries [5]. The need for resilient supply chains has been further underscored by the Russia–Ukraine crisis. The IPEF aims to address supply chain vulnerabilities by fostering global efforts to reduce risks associated with concentrated, fragile supply chains [6].  Figure 4 Resilient supply chain alliance In Figure 4, the EU Commission presented the Single Market Emergency Instrument (SMEI) in September 2022, a crisis governance framework designed to ensure the availability of essential goods and services during future emergencies. The SMEI operates on three levels: contingency planning, vigilance and emergency. The contingency planning phase focuses on collaboration among member states to mitigate supply chain disruption and monitor incidents. The vigilance phase can be activated when a significant disruption is anticipated, enabling specific measures such as mapping and monitoring supply chains and production capacities. Finally, the emergency phase is activated in cases of severe disruption to the functioning of the single market [7]. Establishing a resilient supply chain through international cooperation may be appealing, yet the reality often falls short of the ambition. In South Korea, the IPEF took effect on 17 April 2024, after an extended negotiation process, marking the first multilateral agreement on supply chains. As a result, during non-crisis periods, the 14 member countries will collaborate to strengthen international trade, investment and trade logistics. In times of crisis, member countries will activate a “crisis response network”. Conversely, opportunities for negotiation with China, South Korea’s largest trading partner, are essential for building supply chain resilience [8]. China has pursued an industrial policy focused on enhancing its supply chain management capabilities. In the semiconductor sector, the decoupling between China and the USA has become increasingly evident. Contrary to expectations, China has adopted a policy of internalising its supply chains, returning to the integration strategies of the 2000s rather than furthering globalisation. A promising opportunity for transformation between the two countries has emerged recently. Since 2015, China and South Korea have maintained bilateral FTA, and with the second phase of FTA negotiations currently underway, there is an opportunity to strengthen trade and investment ties, fostering positive progress through international cooperation. 2.4 China manufacturing exodus During the COVID-19 pandemic, China imposed sudden lockdowns without prior notice or preparation, halting production and logistics cycles. This “zero COVID” policy may have triggered a shift towards “de-risking” China from supply chain disruptions. Although China still offers significant advantages as “the factory of the world,” with vast market potential, prolonged trade tensions with the USA, intensified during the Trump administration, have prompted global manufacturers with substantial USA market bases to relocate operations amid rising geopolitical uncertainties. For example, Nike and Adidas have shifted much of their footwear manufacturing to Vietnam, Apple has begun iPhone production at a Foxconn in Chennai, India, and AstraZeneca has contracted production with India’s Serum Institute. In the pre-globalised era, defining the Rule of Origin (ROO) was straightforward, as a product’s components were usually manufactured and assembled within a single country. However, with the complexity of global supply chains, particularly since 2012, determining ROO has become a time-consuming and subjective process. ROO are classified as either non-preferential or preferential. The USA applies non-preferential ROO to restrict imports from countries like Cuba, Iran and North Korea, while offering trade preference programmes for others. Preferential ROO are used to determine duty-free eligibility for imports from approved countries [9], whereas non-preferential ROO play a crucial role in “country of origin labelling, government procurement, enforcement of trade remedy actions, compilation of trade statistics, supply chain security issues.” [10] China manufacturing exodus may negatively impact capital inflows into Hong Kong, traditionally seen as the Gateway to China. In 2023, Hong Kong’s initial public offering volume fell to a 20-year low of $5.9bn [11]. While China-oriented business remains in Hong Kong, which returns fully to Chinese control in 2047, non-China-oriented businesses have migrated to Singapore. As the certainty of contract and ownership rights forms the foundation of capitalism, this capital flight from Hong Kong is likely to persist. 3. Trade logistics and economic corridors Globalisation has allowed supply chains to leverage interdependence and interconnectedness, maximising efficiency. However, while these efficiencies have been beneficial, they have also created a fertile ground for friction between trade partners due to a “survival of the fittest” mindset and the principle of “winner takes all.” This interdependence has also highlighted vulnerabilities; the global supply chain struggled to manage the disruptions caused by COVID-19, prompting a shift towards regional integration initiatives, such as Association of Southeast Asian Nations, Regional Comprehensive Economic Partnership, United States–Mexico–Canada Agreement and Comprehensive and Progressive Agreement for Trans-Pacific Partnership. As the global economy seeks stability, collaboration over competition has become increasingly essential, with economic diplomacy emerging as a priority. The prolonged economic war between China and the USA arguably needs to shift towards economic diplomacy. The global supply chain is restructuring into regional supply chains, building resilience by operating in regional segments that can withstand crises. Michael Porter introduced the concept of value chain as “a set of activities that a firm performs to deliver a valuable product or service to the market.” [12] Complex finished goods often depend on global value chains, traversing multiple countries. As shown in Figure 5, the value chain consists of supply chain and trade channel components. While the focus has traditionally been on which country holds lead status within a regional supply chain, the emphasis is now shifting to how these regional segments can be interconnected and relayed. In this context, the supply chain competition may evolve into a “channel war” in international trade, where trade logistics will centre on the internal flow of goods, standardising channel processes and establishing authority over these channels.  Figure 5 Supply chain v. trade channel 3.1 Trade logistics It is natural for governments to seek environments that enhance competitiveness within in their countries. In terms of trade, effective trade logistics are essential for maintaining competitive advantage. As a prerequisite, a strong IT management infrastructure is indispensable. As shown in Figure 6, trade logistics encompass the internal flow of goods to market, integrating physical infrastructure with operating software – such as transport hubs, warehouses, highways, ports, terminals, trains and shipping vessels. Key areas of conflict in trade logistics involve the standardisation of channel processes and determining who holds governance over operation of these logistics systems. This is equally relevant within the digital economy. Recently, Chinese e-commerce – often referred to as C-commerce – has aggressively sought to gain control over digital distribution channels, interconnected delivery networks and trade logistics via digital platforms. Chinese platforms such as Taobao, Temu and AliExpress are actively working to increase their monthly active users (MAUs), positing themselves as counterweights to USA-based platforms such as Amazon and eBay in digital trade [13].  Figure 6 Trade logistics When the agenda of establishing international trade logistics is introduced to relevant trade members across various countries, initial progress and effective responses are often achieved. However, efforts soon encounter obstacles related to standardising logistics processes and establishing operational governance. Greater reliance on international institutions could help resolve these issues (Bayne, 2017). Yet governments frequently prioritise domestic interests, and after prolonged negotiations, the risk of international agreements failing increases. Amid the economic war between China and the USA, China launched a trade logistics initiative known as the Belt and Road Initiative (BRI), or One Belt One Road, in 2013. Often referred to as the New Silk Road, the BRI aims to establish economic corridors for trade logistics. The World Bank estimates that the BRI could boost trade flows by 4.1% and reduce trade costs by 1.1% [14]. In response, the Biden administration proposed the India-Middle East and Europe Economic Corridor (IMEC) in September 2023 to strengthen transport and communication links between Europe and Asia as a countermeasure to China’s BRI. IMEC has been well received by participating countries, with expectations of fostering economic growth, enhancing connectivity and potentially rebalancing trade and economic relations between the EU and China [15]. Both BRI and IMEC are ambitious projects aimed at boosting international trade through substantial investments in trade logistics infrastructure. Each seeks to assert governance over international trade channels, signalling that the supply chain war may soon evolve into a trade channel war between China and the USA. 3.2 Economic corridors Economic corridors are transport networks designed to support and facilitate the movement of goods, services, people and information. These corridors often include integrated infrastructure, such as highways, railways and ports, linking cities or even countries (Octaviano and Trishia, 2014). They are typically established to connect manufacturing hubs, high-supply and high-demand areas, and producers of value-added goods. Economic corridors comprise both hard infrastructure – such as trade facilities – and soft infrastructure, including trade facilitation and capacity-building measures. The Asian Development Bank introduced the term “economic corridor” in 1998 to describe networks connecting various economic agents within a region [16]. Economic corridors are integrated trade logistics networks, providing essential infrastructure for connecting regional segments of supply chains. As supply chains increasingly operate in regional “chunks,” linking these segments becomes ever more important. Economic corridors typically include a network of transport infrastructure, such as highways, railways, terminals and ports. Initiatives like the BRI and IMEC use economic corridors as instruments of economic diplomacy, shifting strategies from hard power to soft power, as shown in Figure 7. Because less-developed or developing countries often lack sufficient funding to invest in trade logistics, they tend to welcome these initiatives from developed countries, which offer international collaboration and support. However, these initiatives usually come with the condition that participating countries must accept standardised trade processes and governance led by the sponsoring developed country.  Figure 7 Economic corridor initiatives as economic diplomacy To succeed, economic corridors must meet three key conditions [17]. First, government intervention is essential, as economic corridor initiatives primarily involve public infrastructure investments beyond the scope of the private sector. In realising these projects, governments must reconcile three tensions to ensure their policies are mutually supportive: tensions between politics and economics, between international and domestic pressures and between governments and other stakeholders. Second, intermediate outcomes should be measured and demonstrated as results of economic corridors, allowing participants to experience tangible benefits throughout these longer-term projects. Finally, economic corridors should deliver broader benefits. Participants need incentives to utilise the infrastructure sustainably. These benefits may extend beyond economic welfare, such as wages and income, to include social inclusion, equity and environmental gains, which support the long-term viability of the infrastructure. 4. BRI vs IMEC4.1 Belt and Road Initiative (BRI) - Silk Road The BRI can be a modern-day realisation of the Silk Road concept, connecting Europe as a market base with China as a production base. Unlike the ancient Silk Road, which connected trade routes across Eurasia, the BRI poses potential challenges due to its extensive connectivity. Firstly, there are social and environmental externalities, such as increased congestion and accidents from concentrating traffic flows through limited links and nodes within trade networks. Secondly, while the connectivity may benefit the production and market bases at either end, regions situated between these hubs, through which highways and railways pass, may gain minimal advantage. Thirdly, there is often a mismatch between where costs and benefits are realised. Transit regions that facilitate network traffic often see fewer direct benefits compared to high-density nodes within the network. 4.2 India-Middle East and Europe Economic Corridor (IMEC) - The Spice Road The ancient Spice Roads once connected the Middle East and Northeast Africa with Europe, facilitating the exchange of goods such as cinnamon, ginger, pepper and cassia, which, like silk, served as a form of currency. The IMEC proposes a modern route from India to Europe through the United Arab Emirates (UAE), Saudi Arabia, Israel and Greece. Since its announcement in September 2023, some regional experts have expressed reservations about its feasibility, particularly regarding the connection between the Middle East and Israel. The project has faced delays due to the Israel–Hamas war. Despite these challenges, IMEC holds potential to drive economic growth and strengthen connectivity, especially as countries like Vietnam and India emerge as alternative manufacturing bases for companies relocating from China. For Saudi Arabia and the UAE, IMEC is not viewed as a challenge to China but rather as an opportunity to diversify their economies and solidify their roles within the Middle East region [18]. 5. Conclusion A new trade war between China and the USA has begun, with the Biden Administration’s introduction of IMEC as a counter to China’s BRI. This shift could soon transform the nature of economic war from a focus on supply chains to one on trade channels. The China manufacturing exodus was further accelerated by supply disruptions during the COVID-19 pandemic. Amidst the economic tensions between China and the USA, the restructuring of global supply chains into regional networks has made significant progress. With China maintaining its stance on export controls for strategic items, South Korea must prepare for resilient supply chain management. In relation to China–Korea FTA, which is currently undergoing its second phase of negotiation, South Korea should seek clarity on the transparency of China’s strategic item controls. The Committee on Foreign Investment in the United States (CFIUS) plays a key role in monitoring the quality of inbound investments; similarly, South Korea is experiencing increased inbound investment due to the manufacturing shift from China and should apply similar standards to evaluate investment quality. This emerging economic war between China and the USA is now marked by the competing initiatives of the BRI and IMEC. The BRI can be viewed as a modern Silk Road, linking China with Europe, while the IMEC seeks to establish a trade logistics corridor connecting Saudi Arabia, the UAE, Israel and Greece. The South Korean Government should take proactive steps to prepare for the evolving dynamics of the trade war between China and the USA. CitationOh, J.S. (2025), "International trade war - Spice Road against Silk Road", International Trade, Politics and Development, Vol. 9 No. 1, pp. 2-11. https://doi.org/10.1108/ITPD-06-2024-0031  Notes 1. https://www.investopedia.com/terms/s/supplychain.asp2. According to Gary Gereffi et al, 5 governance types of a lead company could be categorised as market, modular, relational, captive and hierarchy.3. Korea imports urea from 12 countries including Qatar, Vietnam, Indonesia and Saudi Arabia, in addition to China.4. https://single-market-economy.ec.europa.eu/sectors/raw-materials/areas-specific-interest/critical-raw-materials/strategic-projects-under-crma_en5. IPEF was launched on May 23,2022 at Tokyo. 14 member countries are Australia, Brunei, Fiji, India, Indonesia, Japan, Republic of Korea, Malaysia, New Zealand, Philippines, Singapore, Thailand, Vietnam and the USA. 4 Pillar of IPEF are Trade (Pillar 1), Supply Chain (Pillar 2),Clean Economy (Pillar 3) and Fair Economy (Pillar 4).6. Critics say “lack of substantive actions and binding commitments, instead focusing on process-driven framework building.” https://www.piie.com/blogs/realtime-economics/its-time-ipef-countries-take-action-supply-chain-resilience7. https://ec.europa.eu/commission/presscorner/detail/en/ip_22_54438. As of 2023, the first-largest trade partner of Korea is China (Trade volume of $267.66bn), the second is the US ($186.96bn) and the third is Vietnam ($79.43bn)9. As preferential ROO contain the labour value content requirement in the USMCA, it could increase compliance costs for importers. https://crsreports.congress.gov/product/pdf/RL/RL3452410. USITC(1996), Country of Origin Marking: Review of Laws, Regulations and Practices, USITC Publication 2975, July, pp. 2–411. https://www.barrons.com/articles/hong-kong-financial-center-china-46ba5d3612. Porter identifies a value chain broken in five primary activities: inbound logistics, operations, outbound logistics, marketing and sales and post-sale services. https://www.usitc.gov/publications/332/journals/concepts_approaches_in_gvc_research_final_april_18.pdf13. MAU is a metric commonly used to identify the number of unique users who engage with apps and website. MAU is an important measurement to the level of platform competitiveness in the digital trade logistics or e-commerce industry.14. https://home.kpmg/xx/en/home/insights/2019/12/china-belt-and-road-initiative-and-the-global-chemical-industry.html15. https://www.bradley.com/insights/publications/2023/10/the-india-middle-east-europe-economic-corridor-prospects-and-challenges-for-us-businesses16. The Asian Development Bank (ADB), which first used the term in 1998, defines economic corridors as important networks or connections between economic agents along a defined geography, which link the supply and demand sides of markets. http://research.bworldonline.com/popular-economics/story.php?id=350&title=Economic-corridors-boost-markets,-living-conditions17. Legovini et al. (2020) comments traditional cross border agreements of transport investment focuses only on a narrow set of direct benefits and cost. However, economic corridors can entail much wider economic benefits and costs such as trade and economic activity, structural change, poverty reduction, pollution and deforestation.18. Arab Centre Washington D.C. https://arabcenterdc.org/resource/the-geopolitics-of-the-india-middle-east-europe-economic-corridor/ References Bayne, N. (2017), Challenge and Response in the New Economic Diplomacy, 4th ed., The New Economic Diplomacy, Routledge, London, p. 19.Blanchard, J.M.F. and Ripsman, N.M. (2008), “A political theory of economic statecraft”, Foreign Policy Analysis, Vol. 4, pp. 371-398, doi: 10.1111/j.1743-8594.2008.00076.x.Gereffi, G., Humphrey, J. and Sturgeon, T. (2005), “The governance of value chain”, Review of International Political Economy, Vol. 12 No. 1, pp. 78-104, doi: 10.1080/09692290500049805.Kraljic, P. (1983), “Purchasing must be supply management”, Harvard Business Review, Vol. 61 No. 5, September.Legovini, A., Duhaut, A. and Bougna, T. (2020), “Economic corridors-transforming the growth potential of transport investments”, p. 10.Octaviano, B.Y. and Trishia, P. (2014), Economic Corridors Boost Markets, Living Conditions, Business World Research, Islamabad, October.United States International Trade Commission (USITC) (1996), “Country of origin marking: Review of Laws, Regulations, and Practices”, USITC Publication, Vol. 2975, July, pp. 2-4.Further readingPorter, M. (1985), Competitive Advantage: Creating and Sustaining Superior Performance, Free Press.Putman, R.D. (1988), “Diplomacy and domestic politics; the logic of two-level games”, International Organization, Vol. 42 No. 4, pp. 427-600.USITC (2019), “Global value chain analysis: concepts and approaches”, Journal of International Commerce and Economics, April, pp. 1-29.