
Energy & Economics
The economic effects of US-China trade wars
Image Source : Shutterstock
Subscribe to our weekly newsletters for free
If you want to subscribe to World & New World Newsletter, please enter
your e-mail


Energy & Economics
Image Source : Shutterstock
First Published in: May.05,2025
May.05, 2025
Share Article


I. Introduction
U.S. trade with China has significantly grown in recent decades and is crucial for both countries. Today, China is one of the largest export markets for U.S. goods and services (second to Mexico), and the United States is the top export market for China. As Figure 1 shows, this trade—much of which increased after China joined the World Trade Organization (WTO) in 2001—has brought lower prices to U.S. consumers and higher profits for American companies. But it also comes with costs, notably the loss of American jobs because of import competition, automation, and multinational companies moving manufacturing overseas.

Figure 1: US-China Trade over the 20 years Source: U.S. Bureau of Economic Analysis.
After President Donald Trump began a so-called trade war with China in 2018, economic tensions between China and the U.S. have been on the rise. Chinese officials have warned that there are “no winners” in a trade war, but the second Trump administration embarked on a new and more aggressive tariff policy.
In the first months of his second administration, Trump has threatened tariffs as high as 145 percent on all Chinese goods, while China’s latest retaliatory tariffs on U.S. imports are as high as 125 percent. The Trump administration claims the levies attempt to punish China for unfair trade practices, including Chinese subsidies that hurt U.S. workers and the long-standing accusation that China pressures American companies to hand over their technology and intellectual property, as well as China’s role in illicit fentanyl trafficking. Some economists doubt, however, that Trump’s aggressive approach will achieve its desired goals and raise concerns that tariffs will drive up inflation and the costs of goods, hurting American consumers and exports.
This paper attempts to examine the economic effects of the U.S.-China trade war. It first shows the economic effects of the U.S.-China trade war under the first Trump administration and then forecasts for the second Trump administration.
II. Trade War between the U.S. and China
As Figure 2 shows, the US trade deficit with China has increased as trade between both countries expanded. Therefore, the first Trump administration started the trade war by imposing higher tariffs on Chinese goods.

Figure 2: US-China Goods Trade (2001-2024)
Figures 3-1, 3-2, and 4 show U.S. and Chinese tariff rates for each other’s goods. As Figure 3-1 shows, the US tariffs on Chinese goods were less than 5 per cent when the first Trump administration began on January 20, 2018. Then the tariff continued to rise. As Figure 3-2 shows, the average US tariffs on China goods were 20.8 percent when the second Trump administration began on January 20, 2025. As Figure 4 shows, after the second Trump administration took office, US tariffs of 10 percent were imposed on all imports from China under the International Emergency Economic Powers Act (IEEPA) on February 1, 2025. Then the Trump administration increased tariffs on Chinese goods to 20 percent on March 3 and to 34 percent on April 2. US tariffs of 10 percent were imposed on nearly all countries under IEEPA, but with some sector carve-outs on April 5. China retaliated against US tariffs by increasing tariffs on U.S. products to 34 percent on April 4 and to 84 percent on April 10. US tariffs ranging from 1 percent to 74 percent were imposed on nearly all countries with a trade surplus with the US, including China (74 percent). US tariff on Chinese goods included an additional 50 percent tariff as counter-retaliation for China’s retaliation announcement on April 10. Then again China faced an additional 41 percent tariff increase under IEEPA (to 125 percent total). However, Trump instituted a broad 90-day pause on steep Liberation Day tariffs, aiming to give time for negotiators to work out new deals. But Trump has not provided a pause for China. In response, China has raised its duties on imports of US goods to 125 percent from 84 percent on April 12, while US tariffs on Chinese imports have increased to 145 percent by adding a 20 percent tariff in relation to the fentanyl.

Figure 3-1: US–China tariff rates toward each other and the rest of the world (ROW) before 2025
Source: MacroMicro. https://en.macromicro.me/charts/130548/china-us-tariff-rates

Figure 3-2: US–China tariff rates toward each other and rest of world, 2018-2025

Figure 4: US–China tariff rates toward each other in 2025
Source: Reuters, April 11, 2025.
III. Economic Effects of the Trade War between the U.S. and China
A. The first Trump administration
Chad Bowen (2023) at the Peterson Institute for International Economics raised a question “was the trade war between U.S. and China worth it for US exporters”? And his answer so far is no. In the middle of the trade war, the United States and China signed a historic trade agreement on a ‘Phase One trade deal’ on January 15, 2020. Bowen supposes that in 2018–21, US goods exports to China of phase one products had grown at the same pace as China’s imports of those products from the world and that US services exports to China had grown at the rate of US services exports to the world. Cumulative US goods and services exports to China in 2018–21 were about 19 percent lower with the trade war and phase one agreement between the two countries (see Figure 5). His estimates suggest that the United States would have avoided export losses of $24 billion (16 percent) in 2018 and $30 billion (20 percent) in 2019 resulting from the trade war. Exports would also have been $27 billion (18 percent) higher in 2020 and $40 billion (23 percent) higher in 2021 than under phase one agreement.

Figure 5: US exports to China would be higher with no trade war.
i. US manufacturing exports suffered in the trade war and did not recover.
As Figure 6 shows, China purchased only 59 percent of the full commitment of US manufactured products in 2020–21 under Phase One trade deal. Manufacturing was the most economically significant part of the trade deal, making up 44 percent of covered US exports in 2017. Autos and aircraft dominated US exports before the trade war. Both did poorly during the period of 2020–2021. US auto exports reached only 39 percent of the target over 2020–21. The sector’s suffering is a trade war warning. In July 2018, Trump’s tariffs on Chinese imports included auto parts; China’s tariff retaliation hit US car exports. US car exports decreased sharply in 2018, as car makers like Tesla and BMW reacted to the higher costs by moving production destined for the Chinese market out of the United States. (Ford, another major car exporter, including through its Lincoln brand, complained in 2018 that Trump’s separate steel and aluminum tariffs raised the cost of its US-based manufacturing by $1 billion.) Even when China lifted the retaliatory tariffs in early 2019, US exports did not recover.
Sales of US aircraft, engines, and parts to China did even worse, reaching just 18 percent of the 2020–21 target. Though the industry was less directly impacted by trade war tariffs, US sales to China plummeted in 2019 after the two crashes of the Boeing 737 MAX. Between March 2019 and late 2020, the airplane model was grounded, with Boeing shutting down production in early 2020. China cancelled orders in April 2020, and though the legal text allows credit for aircraft “orders and deliveries”, additional orders had not been publicly announced by the end of 2021, despite complaints by the Biden administration that China's trade policy was holding back sales. (Exports of the 737 MAX might eventually resume, as Chinese regulators instructed airlines in December 2021 to implement the changes needed to allow the model to fly again in China.) Not all manufactured exports performed poorly during the period of 2020–21. Medical supplies needed to treat Covid-19 significantly increased. US exports of semiconductors and manufacturing equipment also boomed – thanks to a combination of stockpiling by Chinese companies as US export controls in 2019-20 threatened to cut off Chinese firms like SMIC and Huawei as well as increased demand for chips needed for consumer electronics and data servers brought on by the Covid-19 pandemic shift to remote work, schooling, and leisure.

Figure 6: US-China war battered hard US manufacturing exports to China
ii. US agricultural exports suffered in the trade war, received subsidies, and then recovered.
To the Trump administration, agriculture was a very politically important part of the trade deal in 2020, despite accounting for only 14 percent of covered exports. As Figure 7-1 shows, when China's retaliatory tariffs hurt US farm exports during the period of 2018–19, the Trump administration awarded the sector tens of billions of dollars in federal subsidies. In the days leading up to the 2020 presidential election, the Trump administration released a report that touted resuming farm sales to China—ignoring the continued troubles facing US manufacturing, energy, and service exports. US farm exports did get back to 2017 pre-trade war levels and ultimately reached 83 percent of the 2020–21 commitment under Phase One deal (see Figure 7-1 & 7-2).

Figure 7-1: US agricultural exports to China
Soybeans made up approximately 60 percent of US agricultural exports to China in 2017. As Figure 7-2 shows, exports of US soybeans to China were devastated by the trade war, falling from $12 billion to $3 billion in 2018, because China imposed retaliatory tariffs. Though soybean exports managed to reach their pre-trade war levels during the period of 2020–21, they still fell over 30 percent short of their target under Phase One deal. Products like pork, corn, wheat, and sorghum exceeded expectations, though not necessarily because of the trade deal in January 2020. The outbreak of African swine fever led China to increase pork imports from the U.S. in 2019 before the deal was agreed. (In 2020–21, China's pigmeat imports from the rest of the world also averaged five times 2017 levels.) Wheat and corn imports increased after China began to comply with a 2019 WTO dispute settlement ruling against its unfilled tariff rate quotas. (Compared with 2017, China's imports from the rest of the world in 2020–21 were about 200 percent higher for wheat and 350 percent higher for corn.) Some farm exports also benefitted less from the Chinese purchase commitments under the trade deal in January 2020. Seafood and farm products did not rebound from the effects of the trade war. After being hit with Chinese tariffs, US lobster exports re-achieved about half of their target in 2020–21. US exports of raw hides and skins ended up at less than one-third (see Figure 7-2).

Figure 7-2: US agricultural exports to China (sub-category)
iii. U.S. Imports from China: Total US imports from China were down with the beginning of the trade war.
For 15 months beginning in July 2018, the Trump administration imposed higher tariffs on Chinese products. The Trump administration began the trade war by imposing tariffs of 25 percent on products covering roughly $34 billion of US imports from China in July 2018 (List 1) and on $16 billion of imports in August (List 2). When China retaliated against the U.S., the trade war continued with Trump imposing 10 percent tariffs on an additional $200 billion of imports in September 2018 (List 3), increasing the tariff rate of those duties to 25 percent in June 2019. In September 2019, Trump hit another $102 billion of imports (List 4A) with 15 percent tariffs, later reducing them to 7.5 percent upon implementation of the US-China Phase One trade agreement in February 2020. (The administration identified another set of products covering most of the rest of US imports from China of more than $160 billion—List 4B—for which it scheduled tariffs to take effect on December 15, 2019 but was cancelled on December 13, 2019.)
As a result, as Figure 8-1 & 8-2 show, overall, the trade war reduced US imports from China. Then US imports recovered only slowly, starting in mid-2020. In January 2022, when the term of the first Trump administration ended, US imports from China (red line) remained well below the pre-trade war trend (dashed line), while US imports from the rest of the world (blue line) returned to pre-trade war levels of June 2018. China was the source of only 18 percent of total US goods imports in 2022, down from 22 percent at the beginning of the trade war.

Figure 8-1: Value of US goods imports from China and the rest of the world, 2016–2022 (June 2018 = 100)

Figure 8-2: Value of US imports from China and the rest of the world by trade war tariff list, 2018–2022 (June 2018 = 100)
B. The second Trump administration
As of April 12, 2025, U.S. tariffs on Chinese goods are 145 percent, but this tariff rate is not sustainable over a long period of time because it is way too high and because U.S. President Donald Trump and Chinese leader Xi Jinping want to negotiate. In fact, Trump signalled on April 23 that he would cut his 145 percent tariff on Chinese goods substantially. Therefore, it is not reasonable to explore the effects of Trump’s tariffs of 145 percent.
Last year, McKibbin, Hogan, and Noland at the Peterson Institute for International Economics (PIIE) examined the impact of now-President Trump’s proposed tariffs based on Trump’s campaign promises that would impose 60 percent additional tariffs on imports from China. They explored the impacts of a 60 percent additional tariff on China with and without other countries’ retaliating in kind by imposing steeper tariffs on imports from the United States.
Figures 9 through 14 show the results from their analyses. Figure 9 shows that China experiences the most significant GDP losses (0.9% below baseline by 2026), while the U.S. also experiences a negative GDP growth rate (0.2% below baseline by 2027).

Figure 9: Projected change in real GDP of selected economies from an additional 60 percent increase in US tariffs on imports of goods from China, 2025-40
Figure 10 shows that the direct impact of the U.S. tariff of 60 percent on Chinese employment is initially negative (-2.25% in 2025), but a gradual decline in Chinese real wages eventually restores employment to the baseline after a decade. US employment will fall 0.23% below baseline by 2027.

Figure 10: Projected change in employment (hours worked) in selected economies from an additional 60 percent increase in US tariffs on imports of goods from China, 2025-40
Figure 11 shows that US inflation rises by 0.4% in 2025, with the higher cost of imports due to tariffs not offset by the stronger US dollar lowering prices of imports from other countries. The tariffs on US imports from China are mildly deflationary in other countries (see Figure 11).

Figure 11: Projected change in inflation in selected economies from an additional 60 percent increase in US tariffs on imports of goods from China, 2025-40
The slowdown in the Chinese economy causes capital to flow out of China and into other economies. This is initially a financial capital flow responding to a fall in financial rates of return in China and a rise in expected profits in countries like Canada and Mexico. That financial inflow becomes physical investment over time, which increases production capacity in these economies. Countries that receive the capital experience a trade deficit (see figure 12). This additional production enables the rise in exports to the US economy. While the US trade deficit with China shrinks, the overall US trade deficit increases (figure 12) as the partial relocation of production back into the US economy causes the dollar to appreciate.

Figure 12: Projected change in the trade balance of selected economies from an additional 60 percent increase in US tariffs on imports of goods from China, 2025-40
So far, figures have focused on the unilateral imposition of US tariffs on Chinese products. In figure 13, McKibbin, Hogan, and Noland compare projected changes in US GDP from the unilateral imposition of tariffs with a scenario where China retaliates by imposing a 60% tariff on US goods and services. By 2026, US GDP losses from Trump’s tariff policy more than double if China retaliates against the US (see Figure 13).
The impact on US inflation in 2025 yields a similar result (see Figure 14). With Chinese retaliation, US inflation rises 0.7% above baseline compared with 0.4% without retaliation.

Figure 13: Projected change in US GDP from an additional 60 percent increase in US tariffs on imports of goods from China, with and without retaliation by China, 2025-40

Figure 14: Projected change in US inflation from an additional 60 percent increase in US tariffs on imports of goods from China, with and without retaliation by China, 2025-40
IV. Conclusion
This paper showed that U.S. tariffs on Chinese goods imposed by the first Trump administration mainly had negative impacts on U.S. exports, although they reduced U.S. imports from China over a short period of time. The analysis by McKibbin, Hogan, Noland (2024) for the second Trump administration also shows that U.S. tariffs on Chinese goods will have negative impacts on US GDP, inflation, employment, and trade balance. This paper also showed that U.S. tariffs on Chinese goods will have larger negative impacts on U.S. GDP and inflation if China retaliates. Then a question arises: “Why does Trump attempt to impose extremely high tariffs on products from China?”
Larisa Kapustina, Ľudmila Lipková, Yakov Silin and Andrei Drevalev (2020) identify four main reasons that led the U.S. to the greatest trade war between the U.S. and China: a) to reduce the U.S. deficit of bilateral trade and increase the number of U.S. jobs; b) to limit access of Chinese companies to American technologies and prevent digital modernisation of the industry in China; c) to prevent the growth of China’s military strength; and d) to reduce the U.S. federal budget deficit.
References
Bown, Chad, “China bought none of the extra $200 billion of US exports in Trump's trade deal.” Peterson Institute for International Economics, Working Paper. July 19, 2022.
Bown, Chad, “Four years into the trade war, are the US and China decoupling?” Peterson Institute for International Economics, Working Paper. October 20, 2022.
Bown, Chad, “US imports from China are both decoupling and reaching new highs. Here's how.” Peterson Institute for International Economics, Working Paper. March 31, 2023.
Kapustina, Larisa, Ľudmila Lipková, Yakov Silin and Andrei Drevalev, “US-China Trade War: Causes and Consequences.” SHS Web Conference. Volume 73, 2020: 1-13.
McKibbin, W., M. Hogan and M. Noland (2024), “The International Economic Implications of a Second Trump Presidency.” Peterson Institute for International Economics, Working Paper 24-20.
First published in :
World & New World Journal

If the US carries out military strikes against Iran, what will happen to global oil supply and global oil price?
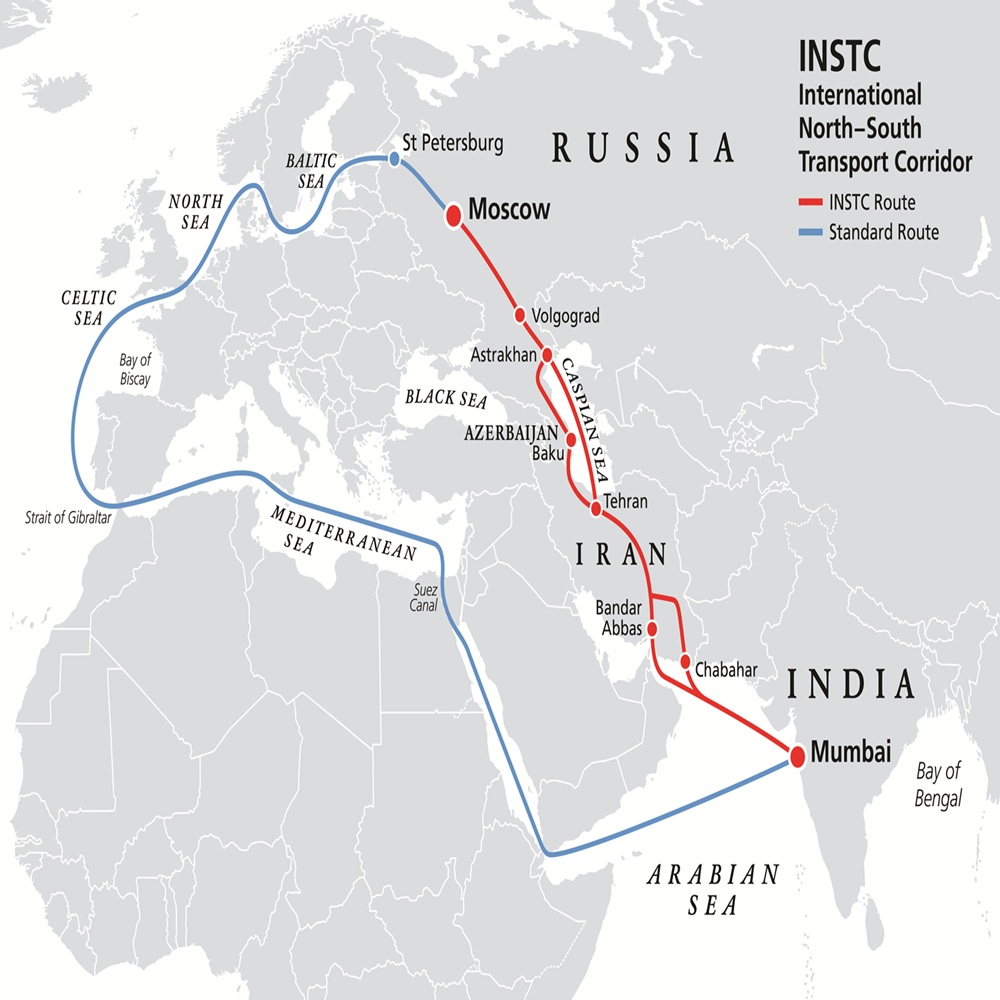
International North-South Transport Corridor: Geopolitical Implications and the Future of European Trade

Why has the German economy underperformed and fallen behind?

The Belt and Road boomed in 2025
Unlock articles by signing up or logging in.
Become a member for unrestricted reading!


