Energy & Economics
Chinese exports to Central Asia after Russia’s invasion of Ukraine

Image Source : Shutterstock
Subscribe to our weekly newsletters for free
If you want to subscribe to World & New World Newsletter, please enter
your e-mail
Energy & Economics

Image Source : Shutterstock
First Published in: Sep.13,2024
Oct.21, 2024
Abstract
This paper looks at the development of Chinese exports to Central Asian countries after Russia’s invasion of Ukraine in February 2022. The analysis, which relies on export data from China to Asian countries at a general product level, shows that China’s exports to Central Asia have significantly increased since the start of the war. In particular, exports to Kazakhstan, Uzbekistan, and Kyrgyzstan have increased significantly. The analysis focuses on exports in Harmonized System (HS) categories 84, 85, 87, and 90. Many of the products sanctioned by the West in trade with Russia belong to these categories, but the categories also include many non-sanctioned products. Although the value of China’s exports to Central Asia is still smaller than direct trade with Russia, China’s exports – especially to Kyrgyzstan – have seen dramatic increases in the HS 84, 85, 87, and 90 categories. Along with the export growth from China to Central Asia, exports in these categories from Central Asia to Russia have also increased significantly.
Keywords: China, Central Asia, Russia, exports
1. Introduction
This policy brief sheds light on the development of Chinese exports to Central Asia after Russia’s invasion of Ukraine in early 2022. The analysis, which focuses on China’s dollar-denominated exports to Kazakhstan, Kyrgyzstan, Tajikistan, Turkmenistan, and Uzbekistan between 2018 and 2023, is based on the monthly and yearly customs data on goods exports from CEIC, China Customs Administration, Kazakhstan Bureau of National Statistics, and UN Comtrade. The analysis considers exports from Central Asian countries to Russia in some key product categories in the same time frame. Data on Chinese exports to Russia and the rest of the world (excluding Russia and Central Asian countries) help broaden the analysis.
The European Union, the United States, as well as a number of other countries, imposed sanctions on Russia in response to its invasion of Ukraine in February 2022. The sanctions packages targeted trade, investment, and cooperation with Russia, including sanctions on exports and imports of goods and services. While China has yet to impose sanctions on Russia, Chinese companies increasingly face the threat of secondary sanctions.
There is evidence that trade sanctions imposed against Russia have been circumvented by redirecting trade through Russia's neighboring countries (e.g. Chupilkin et al., 2023) and that China exports to Russia dual-use goods exploited by the Russian military (Kluge, 2024). This analysis shows that Chinese exports to Central Asia increased significantly after the Russian invasion of Ukraine in 2022. The soaring trade with Kyrgyzstan, a relatively tiny economy, is particularly notable. Chinese exports to Kazakhstan and Uzbekistan also rose sharply. Exports from Central Asian countries to Russia in selected key export categories increased in 2022, with Kazakhstan’s exports growing significantly, making it the largest exporter to Russia among Central Asian countries.
The paper analyzes the export of China to Central Asia by examining Harmonized System (HS) categories 84 (Machinery), 85 (Electrical equipment), 87 (Vehicles), and 90 (Optical and medical instruments). Categories 88 (Aircraft) and 89 (Ships) were omitted from the analysis since their export volumes were irregular and the data are inconsistent. These categories are important since many of the sanctions goods belong to these broad categories and often involve sophisticated technologies essential to Russian military efforts. Additionally, China is a major technology producing country and Russia’s main supplier of sanctioned technology products (Simola, 2024). Not all products in these categories are subject to sanctions and instead the analysis here only provides a broad view of the development of categories with sanctioned products.
The three-part analysis in this brief begins with a discussion of the development of Chinese exports to Central Asian countries at a general level. We then consider Chinese exports to Central Asia in HS categories 84, 85, 87 and 90, and conclude with an overview of Central Asia country exports to Russia in the same HS categories.
2. Chinese trade relations with Central Asia
From a trade perspective, China dominates trade relations with Central Asian countries. Most Central Asian countries run trade deficits with China. While Central Asian countries are geographically proximate with China (Kazakhstan, Kyrgyzstan, and Tajikistan share borders with China), total exports to these countries have traditionally represented a small slice of China’s total exports. In 2018, for example, Kazakhstan accounted for around 0.5 % of China’s total exports, and the shares of China’s exports to Kyrgyzstan, Tajikistan, Turkmenistan, and Uzbekistan were between 0.01 % and 0.2 %. China’s exports to Russia in 2018 were around 2 % that year.
In 2023, however, exports to Kazakhstan had grown to 0.7 % of China’s total exports, and exports to other Central Asian economies were between 0.03 % and 0.6 %. The share of exports to Kyrgyzstan grew from 0.2 % to 0.6 % in terms of China’s total exports. In comparison, Chinese exports to Russia in 2023 represented 3 % of China’s total exports. In terms of annual growth, Kyrgyzstan on-year increase between stands out, with Chinese exports (measured in dollars) growing by 150 % in 2021 and 110 % in 2022.
The countries in the region are not a homogeneous group. Their economies differ in size and trade patterns. Measured by GDP, Kazakhstan was the largest regional economy in 2023, with a GDP of $260 billion. The second largest was Uzbekistan ($90 billion), followed by Turkmenistan ($59 billion), Kyrgyzstan ($14 billion), and Tajikistan ($12 billion) (World Bank, 2024). China’s top export destination in 2023 was Kazakhstan ($25 billion) and Kyrgyzstan ($20 billion). Turkmenistan had the least exports ($1 billion).
In addition to Russia’s war of aggression, new trade routes and warm bilateral relations may have played a role in Chinese exports to Central Asia. New trade routes have opened under the Belt & Road Initiative, and Xi Jinping’s relations with the leaders of Central Asian countries have been generally friendly.
China has been particularly active in Kyrgyzstan, where it has helped to build several transport infrastructure projects to improve transport connections within the country and the region. Especially in mountainous areas, new transport routes and improved logistics connections could have a major impact on trade volumes. Kyrgyzstan also changed presidents in 2021 following snap elections to quell a wave of protest. Kyrgyzstan’s newly elected president, Sadyr Zhaparov, emphasizes China’s importance as Kyrgyzstan’s trading partner and investor, and has called for closer relations with China.
A new trade route from China to Kazakhstan was opened in the summer of 2023 during the China-Central Asia Summit. During Xi Jinping’s visit to Kazakhstan in 2022, the leaders announced to deepen bilateral relations.
Uzbekistan, Turkmenistan, and Tajikistan have established friendly relations with Xi and China. With regard to vehicle exports, it is worth noting that the re-export of cars through the Eurasian Economic Union to Russia previously received tax relief, a policy that ended this year.
3. An overview of Chinese exports to Central Asia
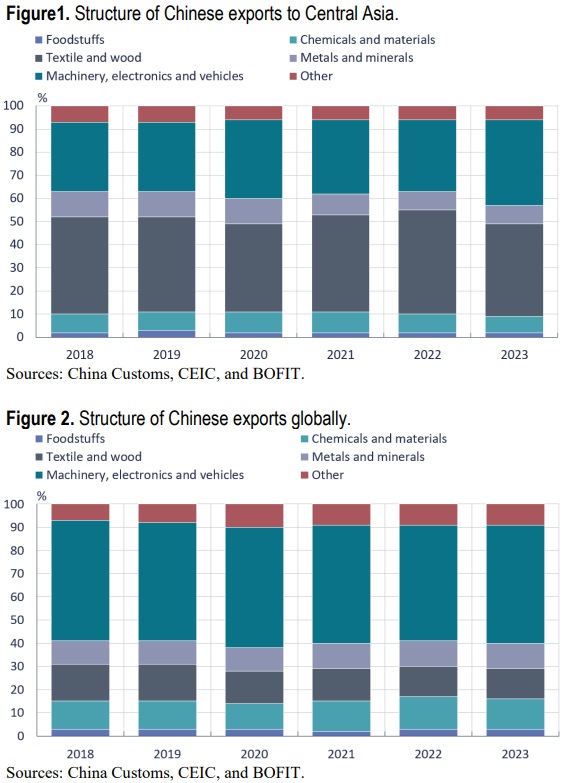
Between 2018 and 2023, China primarily exported textile and wood-related products, as well as machinery, electronics, and vehicles to Central Asia (Figure 1). Compared to China’s overall export structure to the world (Figure 2), the share of textile and wood products in China’s exports to Central Asia is significantly higher. In contrast, approximately 50 % of China’s global exports consist of machinery, electronics, and vehicles, whereas these categories account for about 30–40 % of China’s exports to Central Asia.
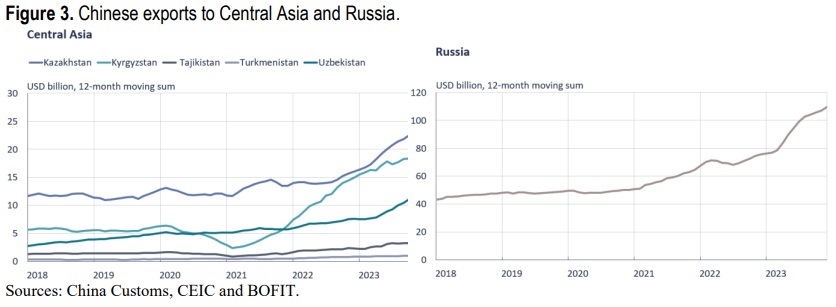
In dollar terms, Chinese exports to Central Asia grew by 170 % from 2018 to 2023. This growth parallels China's export growth to Russia, which increased by 130 % over the same period. For comparison, Chinese exports to the rest of the world grew by around 40 % in that period. The largest export growth was seen in Kazakhstan, Kyrgyzstan, and Uzbekistan (Figure 3), with exports to Kyrgyzstan experiencing an explosive increase at the beginning of 2021. While more moderate, export growth to Kazakhstan and Uzbekistan also took off in the first half of 2022. Chinese exports to Kazakhstan, which were valued at $11 billion in 2018, surged to $25 billion in 2023. Chinese exports to Uzbekistan tripled from $4 billion in 2018 to $12 billion in 2023. Chinese exports more than tripled to Kyrgyzstan during the period from $6 billion in 2018 to $20 billion in 2023. Chinese exports to Kyrgyzstan are significant given the country’s modest GDP. Growth in Chinese exports to Russia mirrors the growth in exports to Central Asia (Figure 3). In dollar terms, however, China's exports to Russia are about double to those of China’s total exports to Central Asia.
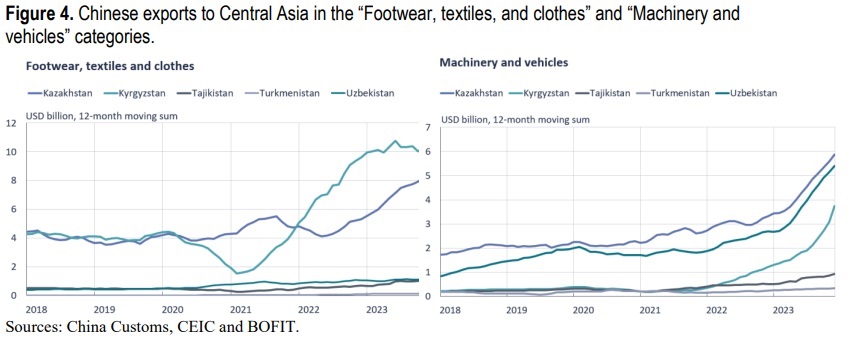
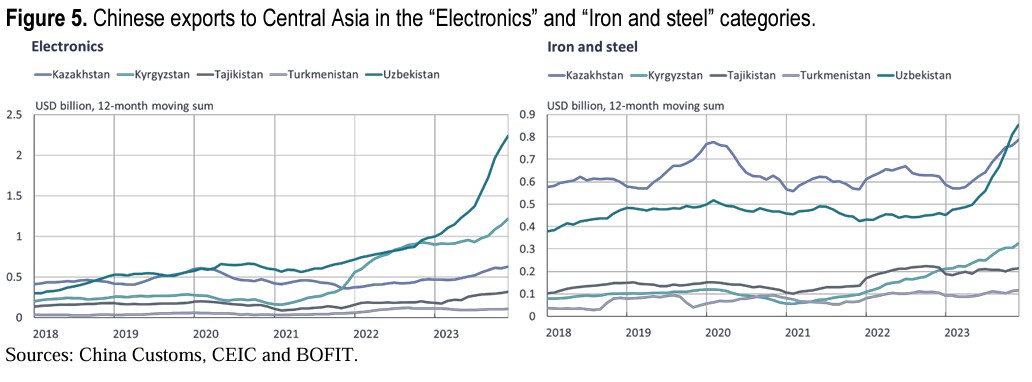
The largest export categories to Central Asia in China’s 2023 export structure were footwear, textiles, and clothes ($20 billion); machinery and vehicles ($11 billion); electronics ($3 billion); and iron and steel ($2 billion). Exports of iron and steel to Tajikistan, Kyrgyzstan, and Turkmenistan were minimal, but significant for Kazakhstan and Uzbekistan, with growth starting in early 2023.
Chinese exports of footwear, textiles and clothes to Kyrgyzstan (and exports generally) began took off in early of 2021 (Figure 4). Kazakhstan’s export growth in the same category started after Russia’s invasion of Ukraine in 2022. Exports of machinery and vehicles to Kazakhstan, Uzbekistan, and Kyrgyzstan (Figure 4) skyrocketed in 2023. Chinese exports of iron and steel to Kazakhstan and Uzbekistan also soared in 2023 (Figure 5). In the export of electronics, Uzbekistan stands out as exports from China more than doubled in 2023 from 2022 levels (Figure 5). Electronics exports to Kyrgyzstan started increase in early 2021 (Figure 5).
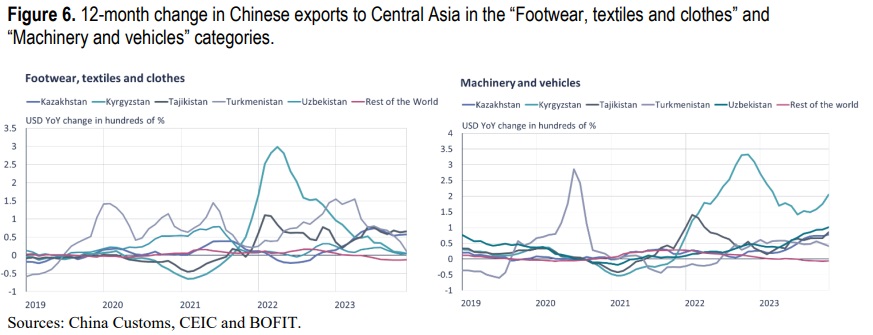
When examining annual changes in these export categories, the dollar-based annual growth of Chinese exports to Kyrgyzstan clearly stands out from other Central Asian countries across all export categories (see Figures 6 and 7). The annual growth to Kyrgyzstan began to increase in early 2021 and remains high throughout 2022. For instance, Chinese exports to Kyrgyzstan in electronics and in footwear, textiles and clothes peaked around 300 % in early 2022. Chinese exports to Turkmenistan and Tajikistan are significantly smaller in dollar terms than for other Central Asian countries, so they do not stand out in earlier figures. However, annual growth patterns show that China’s annual export growth to Turkmenistan and Tajikistan also rose in 2022.

This section examines Chinese exports to Central Asian countries in the HS categories 84 “Machinery,”1 85 “Electrical equipment,”2 87 “Vehicles”,3 and 90 “Optical and medical instruments.”4 HS categories 88 “Aircraft”5 and 89 “Ships”6 were omitted from the analysis since the export volumes were irregular and inconsistent. The data used in the analysis is the sum of HS8-level customs data for the respective category, so values may slightly differ from the actual HS2-level values.
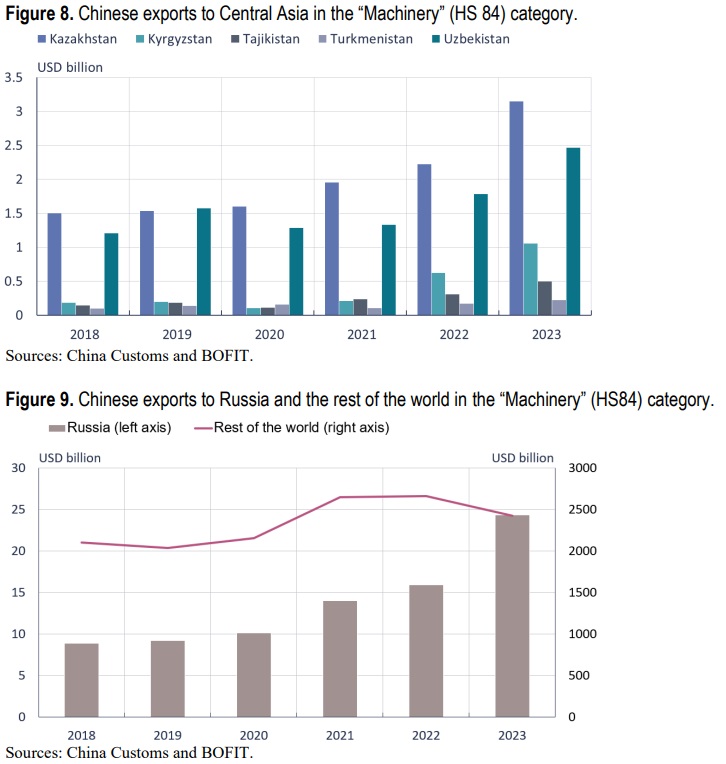
China’s dollar-denominated exports in machinery (HS 84) increased in 2022 and 2023 from the pre-invasions period (Figure 8). Growth in exports is already apparent in 2022 for Kazakhstan, Kyrgyzstan, and Tajikistan, while the rise in Uzbekistan begins in 2023. Exports of machinery to Russia started to increase in 2021, with higher growth in 2022 and 2023 (Figure 9). China’s exports to the rest of the world in the same category rose through 2021, and decreased from 2022 to 2023 (Figure 9).
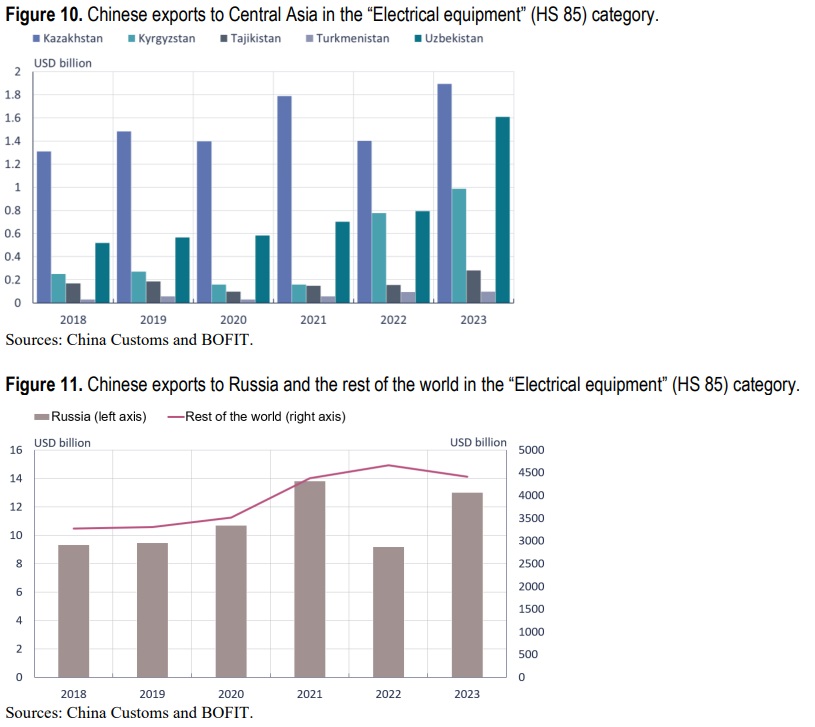
For electrical equipment (HS 85), China’s exports increased significantly compared to the period before the war, especially to Kyrgyzstan, where exports surged in 2022 and continued to grow in 2023 (Figure 10). China’s exports to Uzbekistan also surged in 2023. Exports to Kazakhstan decreased from 2021 to 2022, but grew in 2023, slightly surpassing the 2021 level. When examining Chinese exports to Russia, dollar-denominated changes follow a similar trend (Figure 11). During the same period, China’s exports to the rest of the world increased from 2021 to 2022 and decreased in 2023, a trend similar to that of machinery (Figure 11).
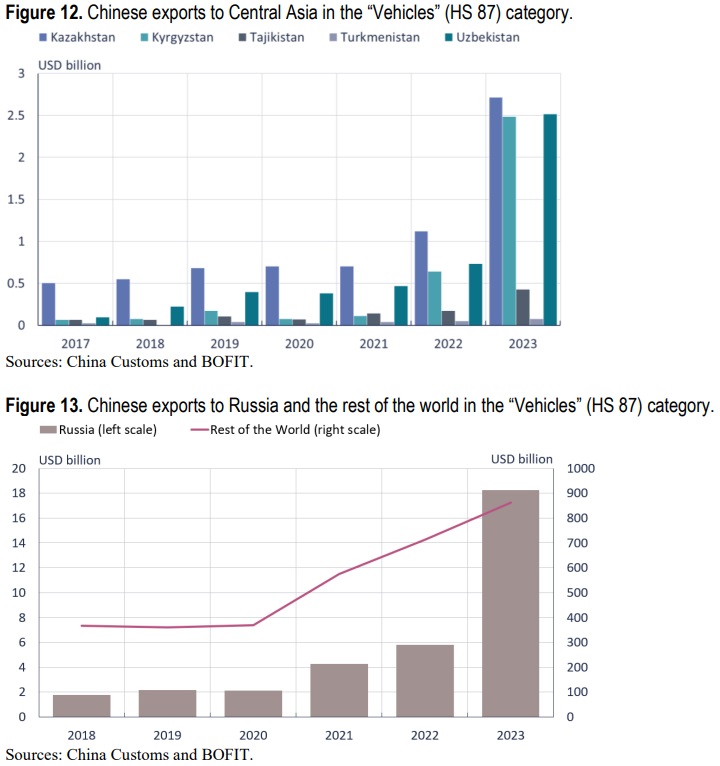
In the export of vehicles (HS 87), China’s exports to Central Asia followed a similar trend in exports to Kazakhstan, Kyrgyzstan, and Uzbekistan, i.e. initial growth in 2022 and strong growth in 2023 (Figure 12). Chinese exports to Russia also surged in 2023 (Figure 13). In the vehicle category, Chinese exports to the rest of the world grew steadily in 2021, 2022, and 2023 (Figure 13).
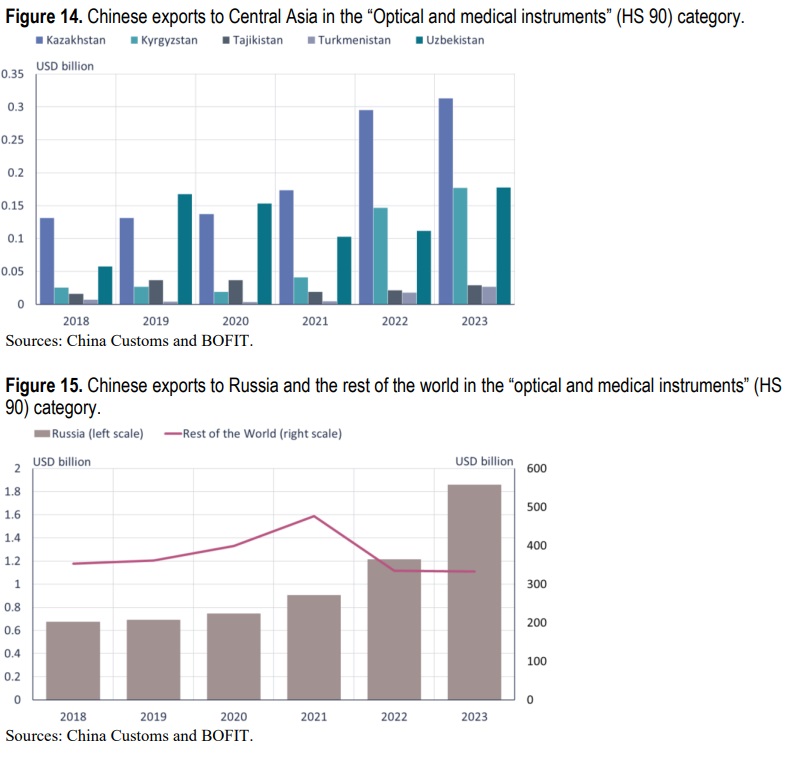
For optical and medical instruments (HS 90), China’s exports to Kazakhstan and Kyrgyzstan increased significantly in 2022, and grew further in 2023, albeit at a more moderate pace (Figure 14). China’s exports to Uzbekistan increased post-invasion in 2022 and 2023, although export levels were similar to 2019 and 2020. Exports to Turkmenistan grew by 260 % in 2022 from the previous year, although this is less noticeable in the figures due to the smaller dollar value amounts related to other Central Asian countries. China’s exports of optical and medical instruments to Russia grew steadily, with a sharper increase beginning in 2022 (Figure 15). However, China’s exports to the rest of the world in this category decreased from 2021 to 2022 (Figure 15).
In summary, China’s dollar-denominated exports to Central Asia increased significantly over the past couple of years, particularly those to Kazakhstan, Kyrgyzstan, and Uzbekistan. Reflecting the general trend of China’s exports to Central Asian countries, the highest dollar amounts for Chinese exports involved products to Kazakhstan across all analyzed harmonized system categories. The most significant dollar-denominated export growth was observed for Kyrgyzstan: the annual growth rate of China’s exports in electrical equipment in 2022 approaches 400 %, and for vehicles nearly 500 % in 2022 and about 300 % in 2023. Additionally, in optical and medical instruments, China’s 2022 exports grew by nearly 300 % to Kyrgyzstan and Turkmenistan from the previous year.
When comparing China’s exports to Central Asia with its exports to Russia, it is evident that the dollar value of China’s exports to Russia is higher than to Central Asian countries, and the dollar value changes in exports are also more significant. For instance, in 2023, China’s exports of machinery to Russia amounted to $24 billion, while exports to the entire Central Asia region were approximately $7 billion. In the electrical equipment category, China’s exports to Russia were $13 billion compared to $5 billion to Central Asia. In the vehicles category, exports to Russia were $18 billion, while exports to Central Asia were $8 billion.
On the other hand, the annual growth rates of individual Central Asian countries are higher in percentage terms compared to Russia. For example, as illustrated in Figure 12, China’s exports to Kyrgyzstan grew from $41 million in 2021 to $1.5 billion in 2022, while China’s exports to Russia increased from $1.2 billion dollars to $1.8 billion in the same period. The annual growth rates for Russia do not exhibit similar spikes, nor do they significantly exceed the growth rates for any Central Asian country in any category.
5. Central Asian exports to Russia in HS categories 84, 85, 87 and 90
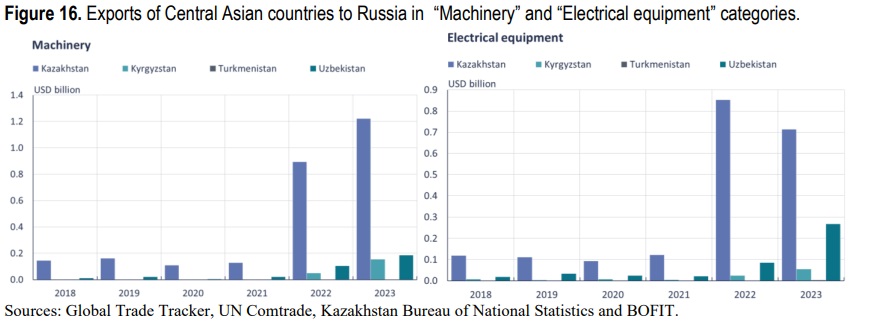
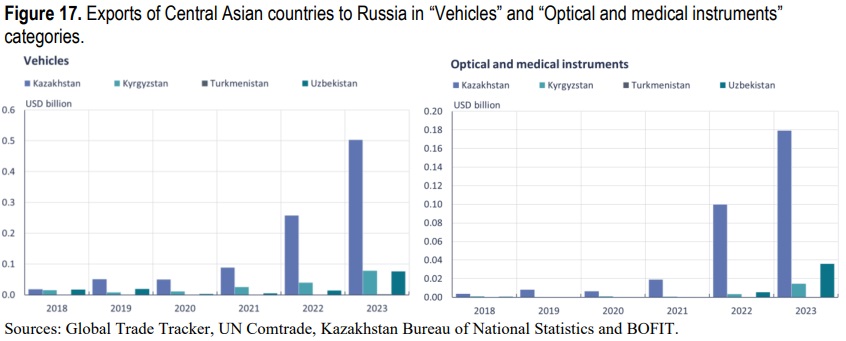
In the HS categories 84 (Machinery), 85 (Electrical equipment), 87 (Vehicles), and 90 (Optical and medical instruments), exports from Central Asian countries to Russia exhibited significant growth in 2022 (Figures 16 and 17), with continued expansion in 2023 (with the exception of Kazakhstan in vehicles and parts). In total, exports from Central Asia (Kazakhstan, Kyrgyzstan, Turkmenistan, and Uzbekistan) in these categories grew in 2022 by 600 % from the previous year. Notably, Kazakhstan was the biggest export in dollar terms. Its exports to Russia surged across all categories in 2022, with on-year growth rates for machinery, electrical equipment and sound devices, and optical and medical instruments ranging between 400 % and 600 %.
In addition to Kazakhstan, Uzbekistan and Kyrgyzstan recorded substantial increases in exports in 2022, particularly in the machinery and electrical equipment categories. Kyrgyzstan’s exports machinery increased from $2 million in 2021 to $49 million in 2022, a jump of about 2,500 %. However, when comparing the Chinese exports to Kyrgyzstan in electrical equipment, the dollar value in exports to Russia seems considerably smaller. Thus, no direct conclusion should be drawn from the fact that higher quantities of electronics pass through Kyrgyzstan to Russia.
Although not depicted in the graph, it is important to highlight Turkmenistan’s growth in the export of electrical equipment in 2023 when it grew from $2,075 (2022) to $3 million in 2023, onyear growth of approximately 200,000 %. Similarly, Uzbekistan’s annual growth in exports of optical and medical instruments was around 40,000 % in 2022.
As to vehicles and parts, Kyrgyzstan’s export growth commenced already in 2021. In the optical and medical instruments category, both Kyrgyzstan and Uzbekistan experienced notable export growth, particularly in 2023. At the HS category levels of 84, 85, 87 and 90, data for Tajikistan’s exports to Russia were unavailable.
6. Conclusion
Chinese exports to Central Asia have significantly increased since Russia’s 2022 invasion of Ukraine, with concurrent growth China’s exports to Russia. Notably, there was a substantial surge in Chinese exports to Kyrgyzstan prior to invasion. Chinese exports to Kyrgyzstan, which has a modest GDP, saw the largest dollar-value increase from 2021 to 2023 in the categories of footwear, textiles, and clothes, as well as machinery and vehicles starting in 2022. The annual growth rates in Chinese exports to Kyrgyzstan show clear increases in the major export categories in 2022.
In dollar terms, Chinese exports to Kazakhstan and Uzbekistan also rose significantly from 2018 to 2023. For Uzbekistan, the largest growth in China's exports began in 2021 in electronics. Exports to Kazakhstan grew the most in 2022–2023 in the categories of footwear, textiles, and clothes, and machinery and vehicles.
The trade categories with notable growth in Chinese exports to Central Asian countries were machinery (HS 84), electrical equipment (HS 85), vehicles (HS 87), and optical and medical instruments (HS 90). Generally, the steepest rise in Chinese exports to Central Asia occurred in the vehicles category, with significant increases in exports to Kazakhstan, Kyrgyzstan, and Uzbekistan in 2022 continuing to a sharp rise in 2023. The trend for Chinese vehicle exports to Russia is similar. It is worth noting that Chinese vehicle exports to the rest of the world also accelerated after 2020. Additionally, there was substantial growth in Chinese exports to Kyrgyzstan in the electrical equipment category in 2022 and 2023. In these categories, Chinese exports to Russia are significantly higher in dollar terms that exports to Central Asia. However, the annual growth rates in between 2018 and 2023 of Chinses exports to individual Central Asian countries have generally seen larger increases in percentage terms than those for Russia.
Exports from Central Asian countries to Russia in the selected key export categories increased significantly across all examined categories in 2022. Among Central Asian countries, Kazakhstan was the largest exporter to Russia in dollar terms from 2018 to 2023, with sharp growth in 2022 in all four categories examined in this paper. Additionally, the exports of Uzbekistan and Kyrgyzstan to Russia grew significantly in 2022, particularly in the categories of machinery, and electrical equipment. The most notable annual growth in exports was posted by Turkmenistan – an increase from $2,075 in 2022 to $3 million in 2023, a 200,000 % increase in electrical equipment exports from the previous year.
References
Chupilkin, Maxim and Javorcik, Beata and Plekhanov, Alexander. (2023). The Eurasian Roundabout: Trade Flows Into Russia Through the Caucasus and Central Asia. EBRD Working Paper No. 276, Available at SSRN: http://dx.doi.org/10.2139/ssrn.4368618 or https://ssrn.com/abstract=4368618
Kluge, Janis. (2024). Russia-China economic relations: Moscow’s road to economic dependence, SWP Research Paper, No. 6/2024, Stiftung Wissenschaft und Politik (SWP), Berlin, https://doi.org/10.18449/2024RP06
Simola, H. (2024). Recent trends in Russia’s import substitution of technology products. BOFIT Policy Brief 5/2024, June 2024.
World Bank, 2024, read 14.8.2024, https://www.worldbank.org/en/region/eca/brief/central-asia
1 Harmonized System code 84: Nuclear reactors, boilers, machinery and mechanical appliances; parts thereof.
2 Harmonized System code 85: Electrical machinery and equipment and parts thereof; sound recorders and reproducers, television image and sound recorders and reproducers, and parts and accessories of such articles.
3 Harmonized System code 87: Vehicles other than railway or tramway rolling stock, and parts and accessories thereof.
4 Harmonized System code 90: Optical, photographic, cinematographic, measuring, checking, precision, medical or surgical instruments and apparatus; parts and accessories thereof.
5 Harmonized System code 88: Aircraft, spacecraft, and parts thereof.
6 Harmonized System code 89: Ships, boats, and floating structures.
First published in :

Henna Hurskainen is an Economist Intern in the Bank of Finland Institute for Emerging Economies. She is a Master of International Relations and currently pursuing her Master of Economics at Tampere University.
Unlock articles by signing up or logging in.
Become a member for unrestricted reading!