Subscribe to our weekly newsletters for free

Subscribe to an email

If you want to subscribe to World & New World Newsletter, please enter
your e-mail

Defense & Security
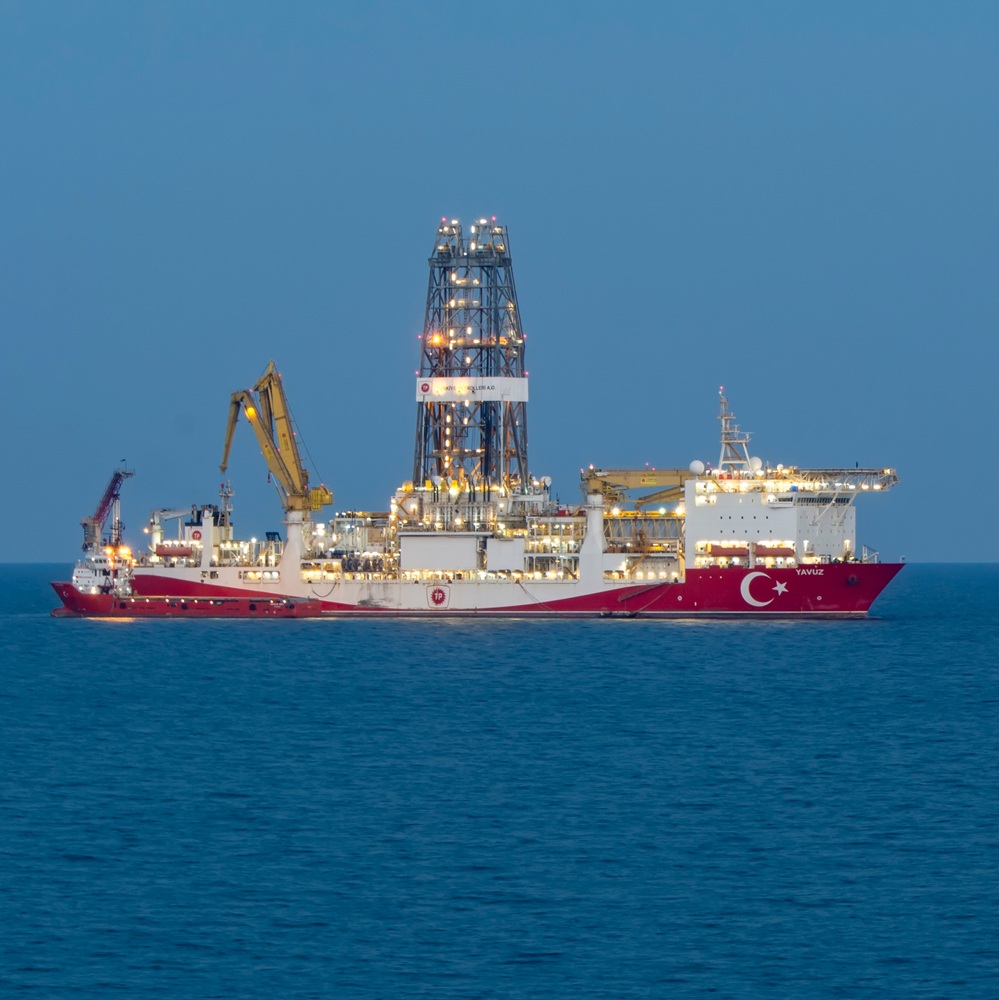
Mersin Turkey - 23.06.2021: Yavuz Drillship on the mediterranean sea. Drillships of Turkey which is search and drill for natural gas and oils.

Mavi Vatan: The turkish strategy for Resources in the Eastern Mediterranean Sea

by Jessica Martínez Pluma

In February 2019, the Turkish Naval Force carried out a large-scale military exercise in the Aegean Sea, the Black Sea, and the Eastern Mediterranean Sea to test the operation of the new weapons and naval systems acquired by the country over the last decade. At first, this event did not generate adverse reactions from the international community, but six months later alarm bells rang when, during a speech by President Recep Tayyip Erdoğan at Turkey’s National Defense University, a map was publicly displayed showing what the Republic of Turkey considered to be its sovereign maritime domains. This later became associated with a concept known as Mavi Vatan. Proposed by Admiral Cihat Yaycı and developed by Admiral Cem Gürdeniz, Mavi Vatan or the Blue Homeland Doctrine is a project and geostrategic representation of Turkey with the intention of claiming the state’s supposed jurisdiction over parts of the Eastern Mediterranean and the Aegean Sea. It demonstrates Turkey’s dissatisfaction with the limits established by international law—the United Nations Convention on the Law of the Sea (1982)—and upholds its right to the legitimate defense of sovereignty over what it asserts are its maritime domains: 462,000 km² comprising its territorial waters, its Exclusive Economic Zone (EEZ), and its continental shelf (Denizeau, A., 2021).  Figure 1: Map of ‘Mavi Vatan’ or the Blue Homeland Doctrine publicly displayed during President Erdoğan’s speech at Turkey’s National Defense University (August 2019). Source: Wikimedia Commons ‘Mavi Vatan’ not only represents a historical claim regarding the events of 2004, when the Republic of Cyprus became an official member of the European Union and established its own maritime borders as a state, which, under the framework of international law, pushed the Republic of Turkey into a narrow strip of sea in which to operate. At the same time, Mavi Vatan emerged as a solution to the growing security challenges that have arisen in the last decade of the 21st century, challenges that have threatened not only the integrity of the state itself but also all those elements that guarantee its survival in the international arena; in this case, Turkey’s access to energy resources. With projections that the Republic of Turkey will reach 90 million inhabitants by 2030 (Martín, L; n.d.), the Turkish state is aware of the increasing energy demands needed to adequately meet the needs of a rapidly growing population. To satisfy that demand, it is compelled to seek optimal sources of income to achieve this purpose. In response—and knowing of the large hydrocarbon reserves discovered in the Eastern Mediterranean Sea in recent years (Zeballos Rivero, M., 2024)—Turkey has turned to Mavi Vatan as a solution. If successfully implemented, it would allow Turkey to establish an area for the exploration and exploitation of resources lying beneath these waters to cover its urgent energy needs. The problem? Turkey is not the only interested party. Countries such as Israel, Lebanon, and Egypt, sharing coastlines with the Eastern Mediterranean Sea, are also engaged in heated disputes over legitimate access to these energy resources. However, the most pressing rivalry remains between Turkey and Cyprus, who, having relatively greater capacities to extract energy resources, have been at the forefront of an active dispute to claim sovereignty over these hydrocarbons.  Figure 2: Map of the EEZs of the Eastern Mediterranean countries and also of Mavi Vatan. Source: Emmanouilidis, C. (2020, August 31). Tensions in the Eastern Mediterranean. European Data Journalist Network. https://www.europeandatajournalism.eu/es/cp_data_news/tensiones-en-el-mediterraneo-oriental/ On the one hand, there is the Cyprus–Egypt–European Union alliance, which has agreed upon and mutually recognized the maritime boundaries corresponding to each of them in the Eastern Mediterranean Sea, while clearly omitting the possible sovereignty claims of other countries in the disputed area (s.autor, 2024). On the other hand, there are Turkey’s individual efforts, which, in its quest to gain access to hydrocarbon resources in the sea in question, signed a Memorandum of Understanding in November 2019 with Libya’s Government of National Accord (GNA) to establish an EEZ stretching from Turkey’s southern coast to the northwestern area of the North African country. This agreement granted the Turks rights to hydrocarbon exploration and exploitation in the zone (s.autor, 2024). Although the agreement was suspended in 2021, Turkey has continued to promote ongoing exploration expeditions in the region, which have even extended to Somali waters, with whom it already has agreements in this field. The firm actions taken by states in the region demonstrate that, beyond being an ambition for access to energy resources in the Eastern Mediterranean, the dispute actually represents an active risk to stability and security in the region. Firstly, from the energy dimension: given the importance of energy resources for human development, the continuation of hostilities among the involved states prevents the establishment of cooperative mechanisms that would allow all parties to benefit from the issue. Instead, it risks generating a zero-sum game in which only the strongest state would emerge victorious while the others remain vulnerable to an imminent energy crisis, thereby putting thousands of human lives at risk. Secondly, from the military dimension, there is the latent possibility that an armed conflict could erupt at any moment in the Eastern Mediterranean over immediate access to the contested resources. Without underestimating the military capabilities of the other countries involved, it is important to highlight the case of Turkey, which in recent years has significantly expanded its military capacities as part of the reformulation of its Foreign Policy. This has allowed Turkey to position itself as the ninth-strongest military power in the world (Global Fire Power, 2025) and the second-largest army within the North Atlantic Treaty Organization (NATO). On the opposite side lies Cyprus, which, although it does not possess the same military capabilities as the Republic of Turkey, does benefit from the direct support of the European Union, which, if necessary, could easily respond to potential acts of aggression in a military conflict in the region. Both sides of the dispute—Turkey and the European Union along with Cyprus—truly have sufficient resources to escalate the conflict if they so desire, but they have not done so for reasons that remain unclear. For now, the situation remains uncertain. Beyond warnings or complaints from some states and/or international organizations, there has been no decisive action to put an immediate end to the conflict, since, in reality, no large-scale crisis has yet warranted such a response. However, it is important not to underestimate the phenomenon: the fact that it has not yet generated a major impact does not mean it could not do so one day, especially considering the great capacities the involved states have both to act and to respond to possible aggression. Historically, disputes over energy resources have generated unprecedented wars that have cost thousands of lives—for example, the Gulf War in 1991. It is therefore necessary to continue monitoring such situations to prevent them from escalating into conflicts as violent as those of the past. Thus, diplomatic channels between all parties to the conflict must be pursued, with the aim of generating cooperative solutions that foster peace and prosperity among nations, rather than new problems. ReferencesDenizeau, A. (abril, 2021) “Mavi Vatan, the ‘Blue Homeland’: The Origins, Influences and Limits of an Ambitious Doctrine for Turkey”, Études de l’Ifri, Ifri.E. (2019, 30 diciembre) La lucha por los recursos en el Mediterráneo Oriental. Anadolu Ajansi. https://www.aa.com.tr/es/mundo/la-lucha-por-los-recursos-en-el-mediterr%C3%A1neo-oriental-/1685950Global Fire Power (2025). 2025 Military Strength Ranking. https://www.globalfirepower.com/countries-listing.phpJager, J.; Norris, A. (2021, 27 septiembre). The Mavi Vatan Doctrine and Blue Homeland Anthem: A Look At Turkey’s Maritime Worldview. Center for International Maritime Security. https://cimsec.org/the-mavi-vatan-doctrine-and-blue-homeland-anthem-a-look-at-turkeys-maritime-worldview/Kaya Ulger, I. (2020, 14 octubre) Turquía continúa defendiendo su “patria azul”. Anadolu Ajansi. https://www.aa.com.tr/es/mundo/turqu%C3%ADa-contin%C3%BAa-defendiendo-su-patria-azul-/2005458Mason, S. (2020, 20 septiembre). Blue Homeland: The Heated Politics Behind Turkey’s New Maritime Strategy - War on the Rocks. War On The Rocks. https://warontherocks.com/2020/06/blue-homeland-the-heated-politics-behind-turkeys-new-maritime-strategy/Martín, L. (s. f.).   ‘Mavi Vatam’: la doctrina turca de la ‘patria azul‘. Global Affairs and Strategic Studies. https://www.unav.edu/web/global-affairs/detalle/-/blogs/-mavi-vatam-la-doctrina-turca-de-la-patria-azul-3Menjón, D. M. (2021, 7 octubre). Dossier Geopolítico Especial: Teoría de la “Patria Azul”. Turquía se proyecta sobre el mar (de la energía). Hermes Kalamos. https://www.hermes-kalamos.eu/dossier-geopolitico-especial-teoria-de-la-patria-azul-turquia-se-proyecta-sobre-el-mar-de-la-energia/S. a. (2024, 10 abril) Cihat Yayci: Libia es un socio estratégico y un aliado para proteger y promover la seguridad de Turquía. OtraLecturA https://otralectura.com/2024/03/15/cihat-yayci-libia-es-un-socio-estrategico-y-un-aliado-para-proteger-y-promover-la-seguridad-de-turquia/S.a. (s. f.). Mavi Vatan-2019 Tatbikatının Ardından Enerji-Politik Ağırlıklı Bir Değerlendirme. Euronewsport İş dünyasından haberler. https://euronewsport.com/mavi-vatan-2019-tatbikatinin-ardindan-enerji-politik-agirlikli-bir-degerlendirme/Zeballos Rivero, M. (2023, 22 marzo). Creciente tensión entre Turquía y Grecia por reservas de gas en el Mediterráneo. Global Affairs And Strategic Studies. https://www.unav.edu/web/global-affairs/creciente-tension-entre-turquia-y-grecia-por-reservas-de-gas-en-el-mediterraneo 

Defense & Security
Flags of Ukraine and the European Union on flagpoles near the office of the President of Ukraine. Kyiv

Assessment of the Limitations of the EU's guarantees regarding Ukraine's security and territorial integrity

by Krzysztof Sliwinski

Abstract This analysis critically examines the European Union's security guarantees for Ukraine as of 2025, amid ongoing conflict and geopolitical tensions. Despite ambitious diplomatic efforts and increased defence spending, the EU faces significant economic and military challenges that undermine its capacity to ensure Ukraine's security and territorial integrity.Economically, the EU struggles with sluggish growth, structural inefficiencies, high public debt, and trade deficits, particularly with China, limiting resources for sustained military investment. Militarily, the EU's fragmented forces and reliance on NATO contrast sharply with Russia's extensive, war-driven military production and strategic nuclear capabilities.The war in Ukraine demonstrates the increasing prominence of drones and missiles, areas where the EU lags behind both Ukraine and Russia in production scale and innovation. Furthermore, the shifting global order towards multipolarity and the strategic alignment of Russia and China further constrain the EU's role as a formidable security actor beyond its borders. Key Words: EU, Ukraine, Security, Guarantees Introduction Russian President Vladimir Putin made a statement on September 5, 2025, warning that any foreign troops deployed to Ukraine — particularly in the context of the "coalition of the willing" led by France and the UK — would be considered legitimate targets for Russian forces. This was in direct response to a summit in Paris on September 4, where 26 countries pledged to contribute to a potential postwar security force for Ukraine, which could involve deploying troops on the ground, at sea, or in the air to deter future aggression after a ceasefire. Putin's exact words, as reported from his appearance at the Eastern Economic Forum in Vladivostok, included: "Therefore, if some troops appear there, especially now, during military operations, we proceed from the fact that these will be legitimate targets for destruction."[i] He further emphasised that even post-ceasefire, he saw no need for such forces if a long-term peace is achieved, adding, "If decisions are reached that lead to peace, to long-term peace, then I simply do not see any sense in their presence on the territory of Ukraine, full stop."[ii] The "coalition of the willing" refers to a group of primarily European and Commonwealth nations, co-chaired by France and Britain, formed in early 2025 to provide security guarantees for Ukraine amid ongoing peace efforts led by US President Donald Trump. Kremlin spokesperson Dmitry Peskov echoed Putin's stance, calling the presence of any foreign or NATO forces near Russia's border a threat and unacceptable.[iii] While Putin did not explicitly name the "coalition of the willing" in his quoted remarks, the timing and context—immediately following the Paris summit announcements—make it clear his warning targets their proposed deployments.[iv] As bold as President Putin's statement is, the EU has been making lots of noise in recent months regarding European guarantees for the future of Ukrainian security and its territorial integrity. This analysis aims to provide a "hard-eyed" assessment of the formidability of these claims, following a previous piece that analysed European diplomatic efforts to support Ukraine's territorial integrity, published here: An analysis of European Diplomatic Efforts to Support Ukraine’s Territorial Integrity. Challenges and Opportunities. EU Economic Stance and Prospects As of 2025, the European Union's economy remains sluggish, troubled by structural inefficiencies and mounting external pressures. Arguably, the EU bloc is increasingly uncompetitive on the global stage. Despite some stabilisation in inflation and resilient labour markets, the overall trajectory suggests a region struggling to keep pace with the United States and China, with GDP growth forecasts hovering around a dismal 1% — well below the global average of 3.2%. This underperformance is not a temporary hiccup but a symptom of deep-rooted issues, including overregulation, demographic decline, and dependency on volatile external factors.[v] Critics argue that the EU's adherence to rigid "globalist" policies, such as burdensome environmental regulations and fragmented fiscal strategies, has stifled innovation and exacerbated trade imbalances, leading to a €305.8 billion deficit with China in 2024 alone. It is pretty probable that without radical reforms, the EU risks sliding into prolonged stagnation or even collapse, as high energy costs erode competitiveness in export markets. State of the Union (2025,10 September ) openly admits that "In the trade of goods, the EU has long had a trade deficit with China. The deficit amounted to €305.8 billion in 2024, surpassing the €297 billion deficit of 2023, but lower than the record trade deficit of €397.3 billion reached in 2022. In terms of volume, the deficit increased from 34.8 million tons in 2023 to 44.5 million tons in 2024. In the period 2015-2024, the deficit quadrupled in volume, while it doubled in value.China is the EU's third-largest partner for exports and its biggest for imports. EU exports to China amounted to €213.3 billion, whereas EU imports from China amounted to €519 billion, indicating year-on-year decreases of 0.3% and 4.6% respectively. In 2024, EU imports of manufactured goods accounted for 96.7% of total imports from China, with primary goods comprising just 3%. The most important manufactured goods were machinery and vehicles (55%), followed by other manufactured goods (34%), and chemicals (8%). In 2024, EU exports of manufactured goods constituted 86.9% of total exports to China, with primary goods making up 11.5%. The most exported manufactured goods were machinery and vehicles (51%), followed by other manufactured goods (20%), and chemicals (17%).[vi] The EU's core metrics reveal an economy that is stable but uninspiring, to put it mildly, with persistent disparities across member states that undermine cohesion.   *Created by Grok – prompt: critical evaluation of the EU economic situation as of 2025. These figures highlight internal fractures: Southern Europe (e.g., Spain at 2.6%) outperforms the core (Germany at 0%), but overall, the bloc's growth is "stuck in first gear," with services stagnant and manufacturing barely registering. Household savings are rebuilding, but consumer confidence remains low amid trade disruptions and geopolitical noise. At its core, the EU suffers from endemic structural flaws that no amount of monetary tinkering can fix. An ageing population—projected to strain fiscal sustainability—exacerbates labour shortages and boosts welfare costs, while policies to increase participation among older workers and women remain inadequate.[vii] Productivity has lagged behind that of the US and Asia for over 15 years, hindered by fragmented regulations that impede innovation in AI and biotech.[viii] The much-touted Green Deal, while environmentally ambitious, imposes extreme costs on industries, with 44% of firms reporting trade disruptions from China (mostly dumping). Energy dependency, exposed by the Ukraine war, has led to sky-high costs that "erode competitiveness," pushing the EU toward deindustrialisation. Critics decry the EU as a "technocratic regime" where national sovereignty is eroded by Brussel’s alleged blackmail tactics, rendering parliaments mere puppets and stifling bold reforms. The EU's economy is dangerously exposed to global headwinds, with risks tilted firmly downward.[ix] Escalating US-China trade tensions, including potential Trump-era tariffs, threaten exports (over 50% of GDP), particularly in the automotive and machinery sectors.[x] Geopolitical conflicts in Ukraine and the Middle East disrupt supply chains and energy prices, while climate events add further volatility.[xi] The loss of the "peace dividend" forces a diversion of resources to defence, inflating costs and deterring investment. Capital outflows to a faster-growing US, driven by tax cuts, compound the issue, leaving Europe starved of investment. Politically, instability, such as France's government collapse over budget cuts (€44 billion), signals deeper fractures, risking social unrest and further eroding confidence.[xii] The analysis above only scratches the surface. To have a better picture, one should also look at current and projected budget deficits and public debts. For example, according to the EU-27, the total public debt was approximately €14.2 trillion in Q1 2025.[xiii] As for budget deficits, the aggregate EU-27 deficit stood at -2.9% of GDP in Q1 2025, according to Eurostat. [xiv] Looking forward, the situation does not seem to look much better. The prospects for public debt and budget deficits in the EU-27 over the next 5 to 10 years are characterised by gradual upward pressure on debt-to-GDP ratios due to persistent deficits, ageing populations, increased defence spending, and potential shocks like higher interest rates or geopolitical tensions. Based on the latest forecasts from the European Commission (Spring 2025), IMF (April 2025 World Economic Outlook and Fiscal Monitor), and other analyses as of September 2025, debt levels are expected to stabilise or edge higher in the short term (2025–2026), with longer-term sustainability risks emerging from megatrends like climate adaptation and demographic shifts. No comprehensive projections extend fully to 2035, but medium-term analyses (up to 2030) suggest debt could rise to 85–90% of GDP for the EU aggregate if fiscal consolidation is uneven. Deficits are projected to hover around -3% of GDP, testing the Maastricht 3% limit, with calls for prudent policies to avoid unsustainable paths.[xv] It is against this backdrop that the SAFE investments, of which I have written here, here, here and here will have to be somehow balanced against other public policies, including immigration, education, public healthcare or housing. The picture does not look good for the EU, to put it mildly. Current European Military Capabilities as Compared to Russia The EU The European Union's military and defence capabilities remain fragmented, relying on the collective forces of its 27 member states rather than a unified army. As of 2025, the EU and the UK boast approximately 1.4 million[xvi] active personnel, over 7,000 tanks, 1,300 combat aircraft, and a naval fleet including 18 submarines and multiple aircraft carriers, primarily from France and Italy. Combined defence spending has risen to approximately 2% of GDP, totalling €343 billion as of 2024, but gaps persist in strategic enablers, such as air defence, munitions, and cyber capabilities.[xvii] The EU's strengths include industrial bases in countries such as Germany and France, which support exports and innovation in areas like drones and AI. The Common Security and Defence Policy (CSDP) facilitate missions, while PESCO fosters joint projects. Recent initiatives, such as the White Paper for European Defence - Readiness 2030 and the ReArm Europe Plan, aim to mobilise €800 billion for investments, including €150 billion via the SAFE loan instrument, targeting two million artillery rounds in 2025, enhanced drone systems, and military mobility.[xviii] The EU's major weaknesses include a heavy reliance on NATO, particularly on US troops, with estimates suggesting that Europe needs an additional 300,000 soldiers and €250 billion annually to achieve independence. This includes addressing shortfalls in tanks (1,400 needed), artillery, and shells (one million for sustained combat). Challenges include political divisions, with Hungary blocking aid, and supply chain vulnerabilities amid climate threats.[xix] Overall, while progress toward a "European pillar" in NATO accelerates, achieving full strategic autonomy by 2030 hinges on member states' commitment to joint procurement and increased spending. The Russian Federation Russia's military capabilities in 2025 are formidable yet strained by the ongoing Ukraine war, with approximately 1.1 million active personnel, including 600,000 deployed near Ukraine.[xx] According to the US Defence Intelligence Agency, Russia's Defence spending reached 15.5 trillion roubles ($150 billion), or 7.2% of GDP, up 3.4% in real terms from 2024, funding war efforts and modernisation. Inventory includes roughly 5,000 tanks (after refurbishing Soviet stocks amid 3,000+ losses), 1,000 combat aircraft (down from pre-war due to 250 losses), and a navy with one aircraft carrier, 60 submarines, and 800 vessels total, emphasising submarine advancements.[xxi] Russia's strengths seem to lie in strategic nuclear forces (1,550 deployed warheads, up to 2,000 non-strategic), electronic warfare, drone production (over 100 daily), and global power projection via naval deployments. Adaptations include glide bombs and unmanned systems, enabling incremental gains in Ukraine despite 750,000 - 790,000 casualties.[xxii] According to experts, Russia's weaknesses include degraded conventional forces against NATO, stagnation in innovation, sanctions-driven dependencies on China/Iran/North Korea, labour shortages, and rising costs that hamper the development of advanced technology.[xxiii] Reforms prioritise nuclear deterrence, robotics, and force enlargement, but demographic/economic constraints may limit rebuilding over a decade. Overall, Russia sustains attrition warfare but faces sustainability challenges for broader threats.[xxiv] The Realities of the Current Wars – the case of the war in Ukraine The war in Ukraine is surprisingly static in a sense in which the First World War was static. We can observe numerous troops fighting a 21st-century version of a trench war, at least to an extent where the front lines seem pretty much fixed. Technological aspects of the Ukrainian war are, however, decidedly different from a hundred years ago. The war in Ukraine is marked by an extensive use of drones. The analysis of available data from the military, UN reports, and media, up to mid-2025, indicates that the weapons causing the highest number of casualties in the Russia-Ukraine war are primarily drones and artillery systems. These two account for most of both military and civilian losses, with a notable shift toward drones in recent years. Total casualties exceed 1.2 million (primarily military, including killed and wounded), though exact figures are estimates due to underreporting and classification issues.   *Generated by Grok. Prompt: What weapons cause the most significant number of casualties in the Ukrainian war? Multiple Sources. Please see below.[xxv] According to publicly available data, military casualties dominate, with around 1.2 million total for Russia and Ukraine combined.[xxvi] As for civilians, the estimates indicate around 50 thousand casualties, mostly from wide-area explosives.[xxvii] Can the EU be a Formidable Military Power of Tomorrow? The existing intel indicates that the drones are responsible for 70 to 80% of battlefield casualties. Exact numbers are naturally difficult to come by, but experts estimate that the total usage of drones likely exceeds production slightly due to imports/donations. Having said that, the production is probably the best indicator. Consequently, the cumulative totals since 2022 exceed 10 million, with 2025 projected to add 7-9 million drones to the battlefield.[xxviii] If this trajectory continues, it means that the future wars will increasingly be fought with drones and missiles, probably operated by AI systems. So how about the EU? The EU production is small-scale and high-value, with countries like France (Parrot SA, Thales) and Germany (Flyability) among the global top 10 manufacturers. No specific unit numbers, but the EU lags in mass production, urging scaling to millions annually for defence. The current output is likely in the tens to hundreds of thousands, primarily focused on (ISR) – Intelligence, Surveillance and Reconnaissance.[xxix] Tellingly, "Defence Data 2024-2025" from the European Defence Agency (EDA) does not even explicitly mention drones or unmanned aerial vehicles (UAVs). At best, the document alludes to the substantial increase in defence investment, procurement, and R&D in the EU Member States in the future, strongly suggesting that unmanned systems, including drones, are part of ongoing and future defence capability developments.[xxx] Interestingly, it is Ukraine that outpaces the EU in its own domestic production of drones. According to the Global Drone Industry 2025 Market Report, Ukraine produced over 2 million drones domestically in 2024 and, per President Zelensky in early 2025, has the capacity to build 4 million drones annually.[xxxi] Among other interesting information, one finds: 1. The global drone market was valued at about $73 billion in 2024 and is forecast to reach $163+ billion by 2030, with a 14%+ CAGR in the latter 2020s2. Military and defence end-use accounted for about 60% of the total drone market value in 2024.3. DJI (Chinese producer) held an estimated 70%+ share of the global drone market by 2024. One of the most promising developments in this respect appears to be the Eurodrone, officially known as the European Medium Altitude Long Endurance Remotely Piloted Aircraft System (MALE RPAS), a twin-turboprop unmanned aerial vehicle (UAV) designed for intelligence, surveillance, target acquisition, and reconnaissance (ISTAR) missions. It is being developed collaboratively by Airbus (leading the project), Dassault Aviation, and Leonardo, under the management of the Organisation for Joint Armament Cooperation (OCCAR), to meet the needs of Germany, France, Italy, and Spain. The program aims to provide a sovereign European capability that's affordable, operationally relevant, and certified for flight in non-segregated airspace, thereby reducing reliance on non-European systems, such as the U.S.-made Reaper drone.[xxxii] As of 2025, it's in the development phase, with the prototype assembly underway and a maiden flight targeted for mid-2027, followed by initial deliveries around 2029-2030. As such, it is still more of a project rather than any real formidable capability.   Source: https://www.statista.com/chart/20005/total-forecast-purchases-of-weaponized-military-drones/   Source: https://quasa.io/media/top-10-drone-manufacturing-countries-in-2025-global-leaders-trends-and-analysis Apart from drones and UAVs, it is missiles that feature prominently in the modern battlefield. Here, the EU's production capabilities seem equally modest. EU production has indeed tripled overall since 2022, driven by the war. Still, it remains defensive-oriented, with slower scale-up due to component shortages (e.g., rocket motors) and a reliance on U.S. partners. Offensive long-range strike capabilities are limited, with focus on air-defence interceptors under initiatives like the European Sky Shield Initiative (ESSI).[xxxiii] Key systems include U.S.-made Patriot (PAC-2 GEM-T and PAC-3 MSE) and European Aster 30 (via MBDA's Eurosam). Global Patriot production is 850 – 880 annually, but Europe receives only 400 – 500. Aster output is 190 – 225 in 2025, nearly all for Europe. Combined, EU availability is 600 – 700 interceptors per year. Under a 2:1 targeting ratio (multiple interceptors per incoming missile), this equates to defending against 235 – 299 ballistic missiles annually. Projections aim for 1,130 by 2027 and 1,470 by 2029, with licensed production in Germany (e.g., Rheinmetall).[xxxiv] Recent analyses indicate Russia has significantly boosted its missile manufacturing since 2022, shifting to a wartime economy with 24/7 operations and foreign inputs (e.g., from North Korea and Iran). Estimates for 2025 suggest an annual output in the thousands, far outpacing pre-war levels, though exact figures are classified and reliant on external intelligence.[xxxv] As for ballistic missiles, Russia's Production of short- and medium-range systems such as the 9M723 (Iskander-M) and Kh-47M2 (Kinzhal) has surged. Pre-war estimates pegged 9M723 at around 72 units per year, but by June 2025, this had risen to at least 720 annually, with monthly output at 60 – 70 units. Kinzhal production stands at 10 – 15 per month (120 – 180 annually). Combined, these yield 840 – 1,020 ballistic missiles per year, marking a 66% increase over the past year and a 15–40% jump in Iskander output alone during the first half of 2025. Regarding cruise missiles, Russia's output has similarly expanded, with the Kh-101 rising from 56 pre-war to over 700 annually. Total land-attack cruise missiles (including 3M-14 Kalibr, Kh-59, and P-800 Oniks adaptations) could reach up to 2,000 per year. Stocks are estimated at 300 – 600 units currently, with projections for 5,000 by 2035. All in all, most experts point to a significant "missile gap" favouring Russia, where its 840 – 1,020 annual ballistic missiles alone exceed the EU's defensive capacity (e.g., intercepting only 300 ballistic threats per year). Russia's total missile/drone output dwarfs EU efforts. However, that is not all; one should also examine the usage and development of AI and AI-driven and operated military systems. This limited analysis does not allow an in-depth look into the matter. I have written about it here, claiming that the current war in Ukraine is also a huge lab for testing AI and AI-driven military systems. Apparently, the "AI arms race" gives Russia's wartime AI applications (e.g., drone swarms) a practical edge, potentially outpacing the EU's ethical focus by 2–3 times in deployment speed. Russia's budget allocations (5–15%) exceed the EU's EDF share (4–8%), but EU venture surges (500% growth) and NATO ties provide qualitative advantages in reliable, regulated AI. Gaps include Russia's hands-on war experience versus the EU's potential lag, with calls for international law bans and more substantial EU investments to counter the risks of escalation. Optimistically, Europe's rearmament ($865 billion) could close the divide by 2030, but analysts warn of vulnerabilities without faster AI scaling.[xxxvi] Last but not least, similar arguments can be made about the munition production capabilities. To cut a long story short, the answer to the question presented in the title of this section has to be rather negative. For example, even NATO officials, including Secretary General Mark Rutte, claimed Russia produces three times as much ammunition in three months as the whole of NATO in a year," implying 9 – 12 million annually, or even 20.5 million for a 12 times advantage. However, analysts critique these as exaggerated, noting Russia's industrial limits make figures above 4 – 6 million unfeasible without full mobilisation. External supplies bolster output: North Korea delivered ~7 million rounds by mid-2025. Russia's $1.1 trillion rearmament plan through 2036 supports long-term growth, but 2025 estimates hover at 3 – 4 million new/refurbished shells.[xxxvii] The New World Order - Incoming!!! Importantly, if the EU were to offer security and territorial integrity guarantees to Ukraine outside NATO, it would not face Russia alone. It would, or should I instead say will, face Russia and China cooperating and supporting each other, with other members of BRICS, remaining negatively neutral, that is, informally supporting Russia. I suggest that, especially a European reader, carry out a little experiment. I propose that they take any map of the world that is printed in China and locate Europe. When looking at the map, the reader is advised to compare the sizes of the territories of the EU countries with those of Russia (and China combined). Apart from that the reader is advised to compare the GDP output of the EU as Against that of Russia and China, their GDP structures, the international trade vectors, structures and volumes, the number of people, natural resources (rare earths as well as gas and coal, the number and strength of TNCs (Trans-National Companies) with headquarters in Asia and Europe. In other words, carry out a simple geopolitical comparison. To say that the EU does not look impressive as compared to Russia and China is to say nothing. When carrying out such a comparison, the observer should swiftly realise that the EU is a small region in the upper left-hand corner of the map and that its relevance and importance regarding most, if not all, of the indicators mentioned above is diminishing. The fact of the matter is that we are witnessing an absolute overhaul of the international system towards a multipolar model with the centre of gravity away from the collective west. There does not seem to be much room for Berlin, Paris or Brussels for that matter to operate as a formidable security agent outside Europe perimeter not only by the virtue of the lack of capabilities and military tools but perhaps most importantly by the lack of international recognition by the three Great powers (USA., China and Russia) and global actors such as BRICS. References[i] Soldatkin, V. (2025, September 5). Putin says any Western troops in Ukraine would be fair targets. Reuters. https://www.reuters.com/business/aerospace-defense/putin-says-any-western-troops-ukraine-would-be-fair-targets-2025-09-05/[ii] Walker, S. (2025, September 5). Western troops in Ukraine would be ‘legitimate targets’, Putin says. The Guardian. https://www.theguardian.com/world/2025/sep/05/western-troops-ukraine-legitimate-targets-vladimir-putin-says[iii] Western troops in Ukraine would be ‘targets’ for Russian forces: Putin. (2025, September 5). Aljazeera. https://www.aljazeera.com/news/2025/9/5/western-troops-in-ukraine-would-be-targets-for-russian-forces-putin[iv] Putin says Russia would consider foreign troops deployed in Ukraine “legitimate targets.” (2025, September 5). CBS NEWS. https://www.cbsnews.com/news/russia-ukraine-war-putin-says-foreign-troops-legitimate-targets/[v] The Conference Board Economic Forecast for the Euro Area Economy. (2025, September 5). The Conference Board. https://www.conference-board.org/publications/eur-forecast[vi] China. EU trade relations with China. Facts, figures and latest developments. (2025, September 9). European Cmmission. https://policy.trade.ec.europa.eu/eu-trade-relationships-country-and-region/countries-and-regions/china_en#:~:text=Trade%20picture,%2C%20and%20chemicals%20(17%25).[vii] A Critical Juncture amid Policy Shifts. (2025, April). International Monetary Fund. https://www.imf.org/en/Publications/WEO/Issues/2025/04/22/world-economic-outlook-april-2025[viii] 3 priorities to boost Europe’s competitiveness in a changing world. (2025, February 20). World Economic Forum. https://www.weforum.org/stories/2025/02/europe-growth-competitiveness/[ix] A Critical Juncture amid Policy Shifts. (2025, April). International Monetary Fund. https://www.imf.org/en/Publications/WEO/Issues/2025/04/22/world-economic-outlook-april-2025[x] Barkin, N. (2025, September 2). Watching China in Europe—September 2025. German Marshall Fund. https://www.gmfus.org/news/watching-china-europe-september-2025[xi] Petersen, T. (2024, December 12). European Economic Outlook 2025: Multiple Crises Dampen the Upswing. Bertelsmann Stiftung. https://bst-europe.eu/economy-security-trade/european-economic-outlook-2025-multiple-crises-dampen-the-upswing/[xii] Experts react: The French government has collapsed again. What does this mean for France, the EU, and Macron? (2025, September 8). Atlantic Council. https://www.atlanticcouncil.org/blogs/new-atlanticist/experts-react/experts-react-the-french-government-has-collapsed-again-what-does-this-mean-for-france-the-eu-and-macron/[xiii] Public debt at 88% of GDP in the euro area. (2025, July 21). Eurostat. https://formatresearch.com/en/2025/07/21/debito-pubblico-all88-del-pil-nellarea-euro-eurostat/[xiv] Government finance statistics. (2025, October 21). Eurostat. https://ec.europa.eu/eurostat/statistics-explained/index.php?title=Government_finance_statistics[xv] International Monetary Fund. (2025). World economic outlook: A critical juncture amid policy shifts. International Monetary Fund. https://www.imf.org/en/Publications/WEO, Europe’s debt set to surge again in new era of uncertainty, IMF warns. (2025, April 24). POLITICO. https://www.politico.eu/article/europe-debt-surge-uncertainty-international-monetary-fund/, Global Economy Faces Trade-Related Headwinds. (n.d.). World Bank Group. Retrieved September 13, 2025, from https://www.worldbank.org/en/publication/global-economic-prospects , Euro Area: IMF Staff Concluding Statement of the 2025 Mission on Common Policies for Member Countries. (2025, June 19). International Monetary Fund. https://www.imf.org/en/News/Articles/2025/06/18/mcs-06182025-euro-area-imf-cs-of-2025-mission-on-common-policies-for-member-countries or Stráský, J., & Giovannelli, F. (2025, July 3). OECD Economic Surveys: European Union and Euro Area 2025. OECD. https://www.oecd.org/en/publications/2025/07/oecd-economic-surveys-european-union-and-euro-area-2025_af6b738a/full-report/repurposing-the-eu-budget-for-new-challenges_b90b1f1d.html[xvi] European Commission (2025, February 21). Defending Europe without the US: first estimates of what is needed. Brugel. https://www.bruegel.org/analysis/defending-europe-without-us-first-estimates-what-needed[xvii] European Commission, EU defence in numbers. European Council, Council of the European Union. Retrieved September 10, 2025, from https://www.consilium.europa.eu/en/policies/defence-numbers/[xviii] European Commission, Acting on defence to protect Europeans. Retrieved September 10, 2025, from https://commission.europa.eu/topics/defence/future-european-defence_en[xix] Mejino-Lopez, J., & Wolff, G. B. (2025). Boosting the European Defence Industry in a Hostile World. Interconomics, 60(1), 34–39. https://www.intereconomics.eu/contents/year/2025/number/1/article/boosting-the-european-defence-industry-in-a-hostile-world.html[xx] Carlough, M., & Harris, B. (n.d.). Comparing the Size and Capabilities of the Russian and Ukrainian Militaries. Retrieved June 3, 2025, from https://www.cfr.org/in-brief/comparing-size-and-capabilities-russian-and-ukrainian-militaries[xxi] Defense Intelligence Agency. (2025). 2025 worldwide threat assessment: Armed Services Subcommittee on Intelligence and Special Operations, United States House of Representatives. U.S. Department of Defense. https://www.dia.mil/Portals/110/Documents/News/2025%20Worldwide%20Threat%20Assessment.pdf[xxii] U.S. Naval Institute Staff. (2025, May 29). Report to Congress on Russian Military Performance. USNI News. https://news.usni.org/2025/05/29/report-to-congress-on-russian-military-performance[xxiii] Boulègue, M. (2025, July 21). Russia’s struggle to modernize its military industry. Chatham House. https://www.chathamhouse.org/about-us/our-people/mathieu-boulegue[xxiv] Foreman, J. (2025, July 9). Military lessons identified by Russia, priorities for reform, and challenges to implementation. New Eurasian Strategies Centre. https://nestcentre.org/military-lessons/[xxv] Adams, P. (2025, July 18). Kill Russian soldiers, win points: Is Ukraine’s new drone scheme gamifying war? BBC. https://www.bbc.com/news/articles/c80p9k1r1dlo, Drones become most common cause of death for civilians in Ukraine war, UN says. (2025, February 11). Reuters. https://www.reuters.com/world/europe/drones-become-most-common-cause-death-civilians-ukraine-war-un-says-2025-02-11/, Grey, S., Shiffman, J., & Martell, A. (2024, July 19). Years of miscalculations by U.S., NATO led to dire shell shortage in Ukraine. Reuters. https://www.reuters.com/investigates/special-report/ukraine-crisis-artillery/, Ukraine: AOAV explosive violence data on harm to civilians. (2025, August 1). Action on Armed Violence (AOAV). https://aoav.org.uk/2025/ukraine-casualty-monitor/, Court, E. (2025, February 13). What is the death toll of Russia’s war in Ukraine? Action on Armed Violence (AOAV). https://kyivindependent.com/a-very-bloody-war-what-is-the-death-toll-of-russias-war-in-ukraine/[xxvi] The Russia-Ukraine War Report Card, July 16, 2025. (n.d.). Harvard Kennedy School, Belfer Centre for Science and International Affairs. Retrieved September 11, 2025, from https://www.russiamatters.org/news/russia-ukraine-war-report-card/russia-ukraine-war-report-card-july-16-2025[xxvii] Number of civilian casualties in Ukraine during Russia’s invasion verified by OHCHR from February 24, 2022 to July 31, 2025. (2022, February 24). STATISTA. https://www.statista.com/statistics/1293492/ukraine-war-casualties/[xxviii] A Perspective on Russia, Facon, S. (n.d.). A Perspective on Russia. Centre for New American Security. Retrieved September 11, 2025, from https://drones.cnas.org/reports/a-perspective-on-russia/ See also: The Russia-Ukraine Drone War: Innovation on the Frontlines and Beyond. (2025, May 28). Centre for Strategic and International Studies. https://www.csis.org/analysis/russia-ukraine-drone-war-innovation-frontlines-and-beyond and Reeves, T. (2025, May 28). JUST IN: Russia Expands Drone Capabilities as Ukraine Conflict Continues. National Defence. https://www.nationaldefensemagazine.org/articles/2025/5/28/as-russia-ukraine-war-continues-so-does-drone-innovation[xxix] Top 10 Drone Manufacturing Countries in 2025: Global Leaders, Trends, and Analysis. (2025, July 19). QUASA. https://quasa.io/media/top-10-drone-manufacturing-countries-in-2025-global-leaders-trends-and-analysis[xxx] European Defence Agency. (2025). Defence Data 2024-2025. European Defence Agency. https://www.eda.europa.eu[xxxi] Global Drone Industry: 2025 Market Report. (2025, July 16). Tech Space 2.0. https://ts2.tech/en/global-drone-industry-2025-market-report/[xxxii] Global Drone Industry: 2025 Market Report. (n.d.). EUROPEAN MEDIUM ALTITUDE LONG ENDURANCE REMOTELY PILOTED AIRCRAFT SYSTEMS – MALE RPAS (EURODRONE). Retrieved September 15, 2025, from https://www.pesco.europa.eu/project/european-medium-altitude-long-endurance-remotely-piloted-aircraft-systems-male-rpas-eurodrone/[xxxiii] Casimiro, C. (2025, August 14). European Defense Production Triples Since Russia-Ukraine War: Report. WAR ON THE ROCKS. https://thedefensepost.com/2025/08/14/european-defense-production-tripled/[xxxiv] Hoffmann, F. (2025, July 6). Europe’s Missile Gap: How Russia Outcompetes Europe in the Conventional Missile Domain. MIssile Matters - with Fabian Hoffmann. https://missilematters.substack.com/p/europes-missile-gap-how-russia-outcompetes[xxxv] Hoffmann, F. (2025, September 8). Denial Won’t Do: Europe Needs a Punishment-Based Conventional Counterstrike Strategy. WAR ON THE ROCKS. https://warontherocks.com/2025/09/denial-wont-do-europe-needs-a-punishment-based-conventional-counterstrike-strategy/[xxxvi] Zysk, K. (2023, November 20). Struggling, Not Crumbling: Russian Defence AI in a Time of War. Royal United Services Institute (RUSI). https://www.rusi.org/explore-our-research/publications/commentary/struggling-not-crumbling-russian-defence-ai-time-war and Cohen, J. (2025, June 30). The Future of European Defense. Goldman Sachs. https://www.goldmansachs.com/insights/articles/the-future-of-european-defense[xxxvii] Lehalau, Y. (2025, July 25). Is Russia Outpacing NATO In Weapons Production? Radio Free Europe, Radio Liberty. https://www.rferl.org/a/russia-nato-weapons-production-us-germany/33482927.html
Energy & Economics
Silhouette of a person holding a smartphone in front of the flag of The European Union (EU)

The European smartphone market: premium loyalty, Chinese competition, and tariff pressure

by World & New World Journal

SummaryApple and Samsung remain the dominant forces in the European smartphone market, but Chinese brands are moving up the ranks and capturing market share - especially in the mid-range and premium segments. Trade measures and new EU regulations (eco-design) as well as regional economic weaknesses will influence demand and pricing in 2025.  Source:  https://gs.statcounter.com/vendor-market-share/mobile/europe? A look at Apple in Europe Apple holds a unique position in Europe, as it focuses less on pure delivery volume and more on anchoring itself in the premium segment. About one in three active smartphones in Europe is an iPhone [1], a number that matters more than quarterly shipment fluctuations. Even as shipments in Europe fell by nine percent in mid-2025, Apple's large installed base and trade-in programs helped maintain momentum [2]. Germany is a telling case in point. Apple's market share here is just over thirty percent, due to a mix of price-sensitive Android buyers and a strong premium niche who opt for iPhones due to the stability of the ecosystem, resale value, and perceived better privacy [3]. Penetration is higher in the more affluent northern and western markets, from the Nordics to the UK, underlining why Apple's marketing and retail strategy is heavily focused on these regions. Loyalty binds these markets together: almost nine out of ten iPhone users stay with the brand when they upgrade [4]. Combined with the high resale value, this reinforces the benefits of ownership. The iPhone 17 offers subtle but strategic updates - more base storage, improved cameras, and a slimmer 'Air' edition - aimed at retaining existing users rather than shaking up the market [5]. Behind the scenes, Apple is also quietly shifting supply chains and expanding iPhone assembly in India to be less vulnerable to tariff shocks and geopolitical risks [6]. For Europe, this means more stable pricing in the medium term, even as the EU tightens its regulations on eco-design and repairability. In short, Apple's strength in Europe comes not from chasing every segment, but from cultivating a premium base that rarely deviates. This base is both its shield and its springboard as competitors aggressively push into the mid-range and even the premium segment.  Source: Shutterstock/Elvard project -  BSD City, Indonesia, August 21, 2025 Back of an orange iPhone 17 Pro and an orange Samsung S22 Ultra A look at Samsung in Europe Samsung continues to be a consistent powerhouse in the European smartphone market. Unlike Apple, which is firmly anchored in the premium segment, Samsung's influence extends across all segments. From the high-end Galaxy S/Ultra series to the growing range of foldable devices and the hugely popular mid-range Galaxy A devices, Samsung ensures that there is a flagship-quality option in every price segment. This range is one of the reasons why the company consistently is the largest smartphone supplier in Europe by volume, claiming around 36% of the European market in the second quarter of 2025 [2]. The Galaxy A series, which includes models such as the A16 5G and the A56, has played a special role in this. These mid-range devices offer a good balance of performance, camera quality, and affordability, making them particularly appealing to price-sensitive consumers. The A56 alone recorded a 12% increase in sales compared to its predecessor, despite a slight decline in Western European smartphone sales overall [7]. Samsung's appeal goes beyond hardware. Through close partnerships with carriers and retail chains, the company has a reach that few rivals can match, enabling promotions, bundles and financing offers that appeal to buyers from all demographics. Android's flexibility is another draw - customers who value customization, connectivity with non-Apple devices or advanced camera and display features often choose Samsung. Samsung's multi-tiered approach gives the company versatility and resilience. While Apple focuses on customer loyalty and premium margins, Samsung covers both the high-end and mid-range segments. Foldables and advanced mid-range devices are particularly popular in the tech-savvy cities of Europe, where buyers like to experiment with features and form factors. In short, Samsung's European approach is broad rather than exclusive - covering premium aspirations, mainstream demand, and everything in between. This ensures that the brand has a strong presence across all consumer segments, from students seeking reliable mid-range phones to professionals looking for innovative flagships. Other brands in Europe While Apple and Samsung dominate the European smartphone landscape, other brands are quietly reshaping the market. Chinese manufacturers, including Xiaomi, HONOR, realme, OPPO and OnePlus, have been steadily gaining ground, especially in the mid-range segment where value for money is most important. Some of these brands are even making inroads into the premium segment, experimenting with foldable devices and advanced camera features, trying to establish themselves as credible alternatives to the established giants. Their approach is a balanced mix of aggressive pricing to attract first-time buyers and selective launches at the high end to build prestige and brand awareness [8][1]. In the meantime, smaller vendors continue to carve out their niches. Google's Pixel phones, for example, appeal to consumers who value a clean Android experience, consistent software updates, and high-quality cameras. Motorola and Sony have a smaller but loyal following, often among buyers who value reliable hardware at a fair price. In Eastern Europe and emerging markets, brands such as Transsion have started to offer very affordable devices tailored to specific regional needs, further increasing consumer choice. These players are making the European smartphone market increasingly dynamic, offering consumers more choice - from advanced cameras to flexible Android software and competitive pricing. While Apple and Samsung continue to dominate the premium and mass market segments, other brands are steadily changing the perception of what a European smartphone can offer.  Source: Shutterstock/ICXd Thailand,Bangkok - August 27, Collection of popular mobile phone logo apple, huawei, samsung, nokia, realme, oneplus, lenovo, lava, sony, LG, Xiaomi, Motorola,oppo, vivo, ZTE Global problems with tariffs on smartphones The smartphone world is not just about innovation, but also about politics. In 2024-25, tariffs on Chinese goods made headlines. The US threatened to impose high tariffs on electronics, which could have driven up the prices of smartphones and laptops. Industry lobbying softened the blow: key categories such as smartphones were exempted from the strictest reciprocal tariffs, which could have mitigated a massive price shock, although uncertainty in global supply chains remains a major problem [9][10]. Europe, on the other hand, has avoided blunt tariffs on smartphones. Instead, manufacturers are navigating regulatory changes - eco-design requirements, repair standards, and trade barriers - that subtly increase costs. The result is less dramatic headlines, but no less tension for OEMs who are closely watching trade measures between the U.S. and China as they affect sourcing and assembly globally. Companies like Apple and Samsung are hedging against this uncertainty by diversifying their production. Apple has ramped up iPhone assembly in India, while other brands are spreading their production to Vietnam, Malaysia, and other countries. Impending tariffs and changing regulations may affect lead times and profit margins, even if European consumers are not yet feeling the direct impact [10]. Slower economic growth makes mid-price alternatives and competitive Chinese brands more attractive. Flagship smartphones, which often cost more than €1,500, raise the question of whether ultra-premium devices still fit into everyday life in times of rising living costs. Consumer preferences in Europe European smartphone buyers are not a monolith. Broadly speaking, the market is split into two camps. Premium buyers value ecosystem integration, software updates and build quality and opt for Apple and Samsung. Value-conscious buyers focus on value for money and are increasingly opting for brands such as Xiaomi, realme and HONOR. Financing options, carrier subsidies and trade-in programs often influence when and how customers upgrade [11]. Trust and perception also play a role - especially in Germany. Privacy concerns and political sentiment towards China weigh heavily. German consumers, both individuals and businesses, are wary of Chinese-made devices in sensitive areas, giving Apple and Samsung an advantage when it comes to security and brand awareness [12].  Source: Shutterstock/Anatoliy Cherkas Customer comparing various mobile phones in a tech store, selecting the ideal device tailored to her unique needs and preferences The upgrade rhythms differ depending on the ecosystem. iPhone owners show strong loyalty, while Android buyers - especially in mid-range segments - switch brands more frequently due to better features or price. This behavior explains the rapid growth of Chinese OEMs and mid-range models and illustrates how ecosystem and satisfaction lead to repeat purchases [13]. In short, European consumers weigh price, performance, ecosystem, and trust - factors that vary depending on whether the buyer is a premium enthusiast or a value seeker. This nuanced behavior influences how brands position devices, launch models and plan for long-term growth on the continent. iPhone 17 vs Galaxy S25 — Tech Comparison   Source: Shutterstock/Sashkin Modern lens of smartphone double camera structure. New features for a smartphone camera concept. 3d illustration Observations: Where Each Excels & Trade-Offs • Cameras: Samsung (especially Ultra) wins on sheer versatility (more lenses, higher MP, better telephoto) and possibly low-light/detail thanks to sensor size and AI noise reduction. iPhone 17 shines in video consistency, processing, and front-facing “Center Stage” improvements. • Display & Brightness: Both are strong; iPhone probably edges ahead in outdoor brightness/visibility with peak luminance claims; Samsung wins in display size options (Ultra, plus), scaling, and maybe smoother animations thanks to their hardware + adaptive refresh tech. • Battery & Charging: Samsung has larger batteries in its high-end models; iPhone balances good battery with durability and efficient hardware. Charging speeds might favor Samsung in some markets, but Apple now supports faster wired/wireless + MagSafe maintained. • Hardware / Performance: Samsung’s chipset leap shows up in raw power + AI task support. Apple’s A19 is very efficient, tightly integrated, often delivering real performance with lower power draw. Apple also tends to offer longer software support. • AI & OS: Samsung pushes more aggressively into “AI companion” territory, making more tasks on-device that used to require cloud. iPhone focuses on privacy, on-device intelligence, camera/AI tools, and a more closed ecosystem. Preference depends on how much a user values customization versus privacy and integration.What about European brands? In Europe, there are no longer many smartphone manufacturers that cover the entire spectrum. Most local activities focus on software, components, or niche manufacturers such as Fairphone, which emphasize sustainability, modular design and repairability. These brands appeal to consumers for whom ethics and environmental responsibility are more important than innovative technical specifications. Even large corporations such as VW and BMW are only tentatively dabbling in this area and have yet to launch devices for the mass market. The reality is that global giants such as Apple, Samsung and increasingly aggressive Chinese OEMs dominate the European smartphone market, while domestic brands occupy specialized niches [14]. Market outlook In the short term - i.e., over the next 12 months - smartphone shipments in Europe could stagnate or decline due to economic restraint, the rising cost of living and stricter EU eco-design regulations. The premium segment remains resilient: Apple, high-end Samsung models and top Chinese devices continue to appeal to buyers seeking quality, design, and ecosystem benefits. Chinese brands are steadily gaining traction in the mid-price segment, especially in markets that are less sensitive to country-of-origin concerns [2]. Looking ahead to the next 24 months, several forces will change the landscape. Supply chains will diversify, with more assembly in India and Southeast Asia reducing dependence on China. Competition will intensify with AI features, voice assistants, and foldable devices as brands differentiate beyond hardware. Regulatory pressure on repairability, durability and sustainability could increase prices or shift the perception of value towards software and services. Apple's service ecosystem could gain traction, while Samsung's breadth and Chinese OEMs' aggressive pricing ensure a dynamic market for European consumers [15].  Source: Shutterstock/Sayan Puangkham Timeline to 2026 – Business Growth and Future Strategy, A futuristic business timeline concept moving from 2020 to 2026. A hand points toward the glowing year 2026. Sources:[1] StatCounter, Mobile Vendor Market Share Europe, Aug 2025 https://gs.statcounter.com/vendor-market-share/mobile/europe [2] Canalys, Europe smartphone shipments Q2 2025 https://canalys.com/newsroom/europe-smartphone-market-q2-2025 [3] StatCounter, iOS share Germany 2025https://gs.statcounter.com/os-market-share/mobile/germany [4] CIRP, iPhone loyalty and resale value 2024–25https://appleworld.today/2025/08/cirp-apple-loyalty-depends-on-carrier-loyalty/ [5] TechRadar/Macworld, iPhone 17 launch coverage, Sept 2025https://www.techradar.com/news/new-apple-event [6] Reuters, Apple expands India assembly, 2025 https://www.reuters.com/world/china/apple-aims-source-all-us-iphones-india-pivot-away-china-ft-reports-2025-04-25[7] SamMobile, Samsung mid-range phones success in Europe, https://www.sammobile.com/news/guess-which-samsung-mid-range-phone-is-a-massive-hit-in-europe/8] Financial Times, Chinese smartphone brands target Europe with mid-range and premium launches, 2025, https://www.ft.com/content/a982abf2-9564-4a8c-b8df-9e614ecd2151[9] Reuters, U.S. exempts key electronics from severe tariffs after industry lobbying, 2025, https://www.reuters.com/technology/us-exempts-electronics-tariffs-2025-06-15 [10] Avalara, Global tariff landscape and smartphone supply chain impact, 2025, https://www.avalara.com/blog/en/2025/05/global-tariff-impact-smartphones.html[11] Financial Times, European consumers split between premium and value smartphones, 2025, https://www.ft.com/content/consumer-smartphone-trends-europe-2025 [12] Emerald Insight, Country of origin and consumer electronics perception in Europe, 2024, https://www.emerald.com/insight/content/doi/10.1108/XXXXX/full/html [13] Backlinko, iOS vs Android loyalty in European smartphone users, 2025, https://backlinko.com/ios-android-loyalty[14] Patently Apple, European smartphone brands and market presence, 2025, https://www.patentlyapple.com/patently-apple/2025/02/european-smartphone-brands.html [15] Reuters, Smartphone industry outlook: supply chains, AI, and regulatory pressure, 2025, https://www.reuters.com/technology/smartphone-outlook-2025

Defense & Security
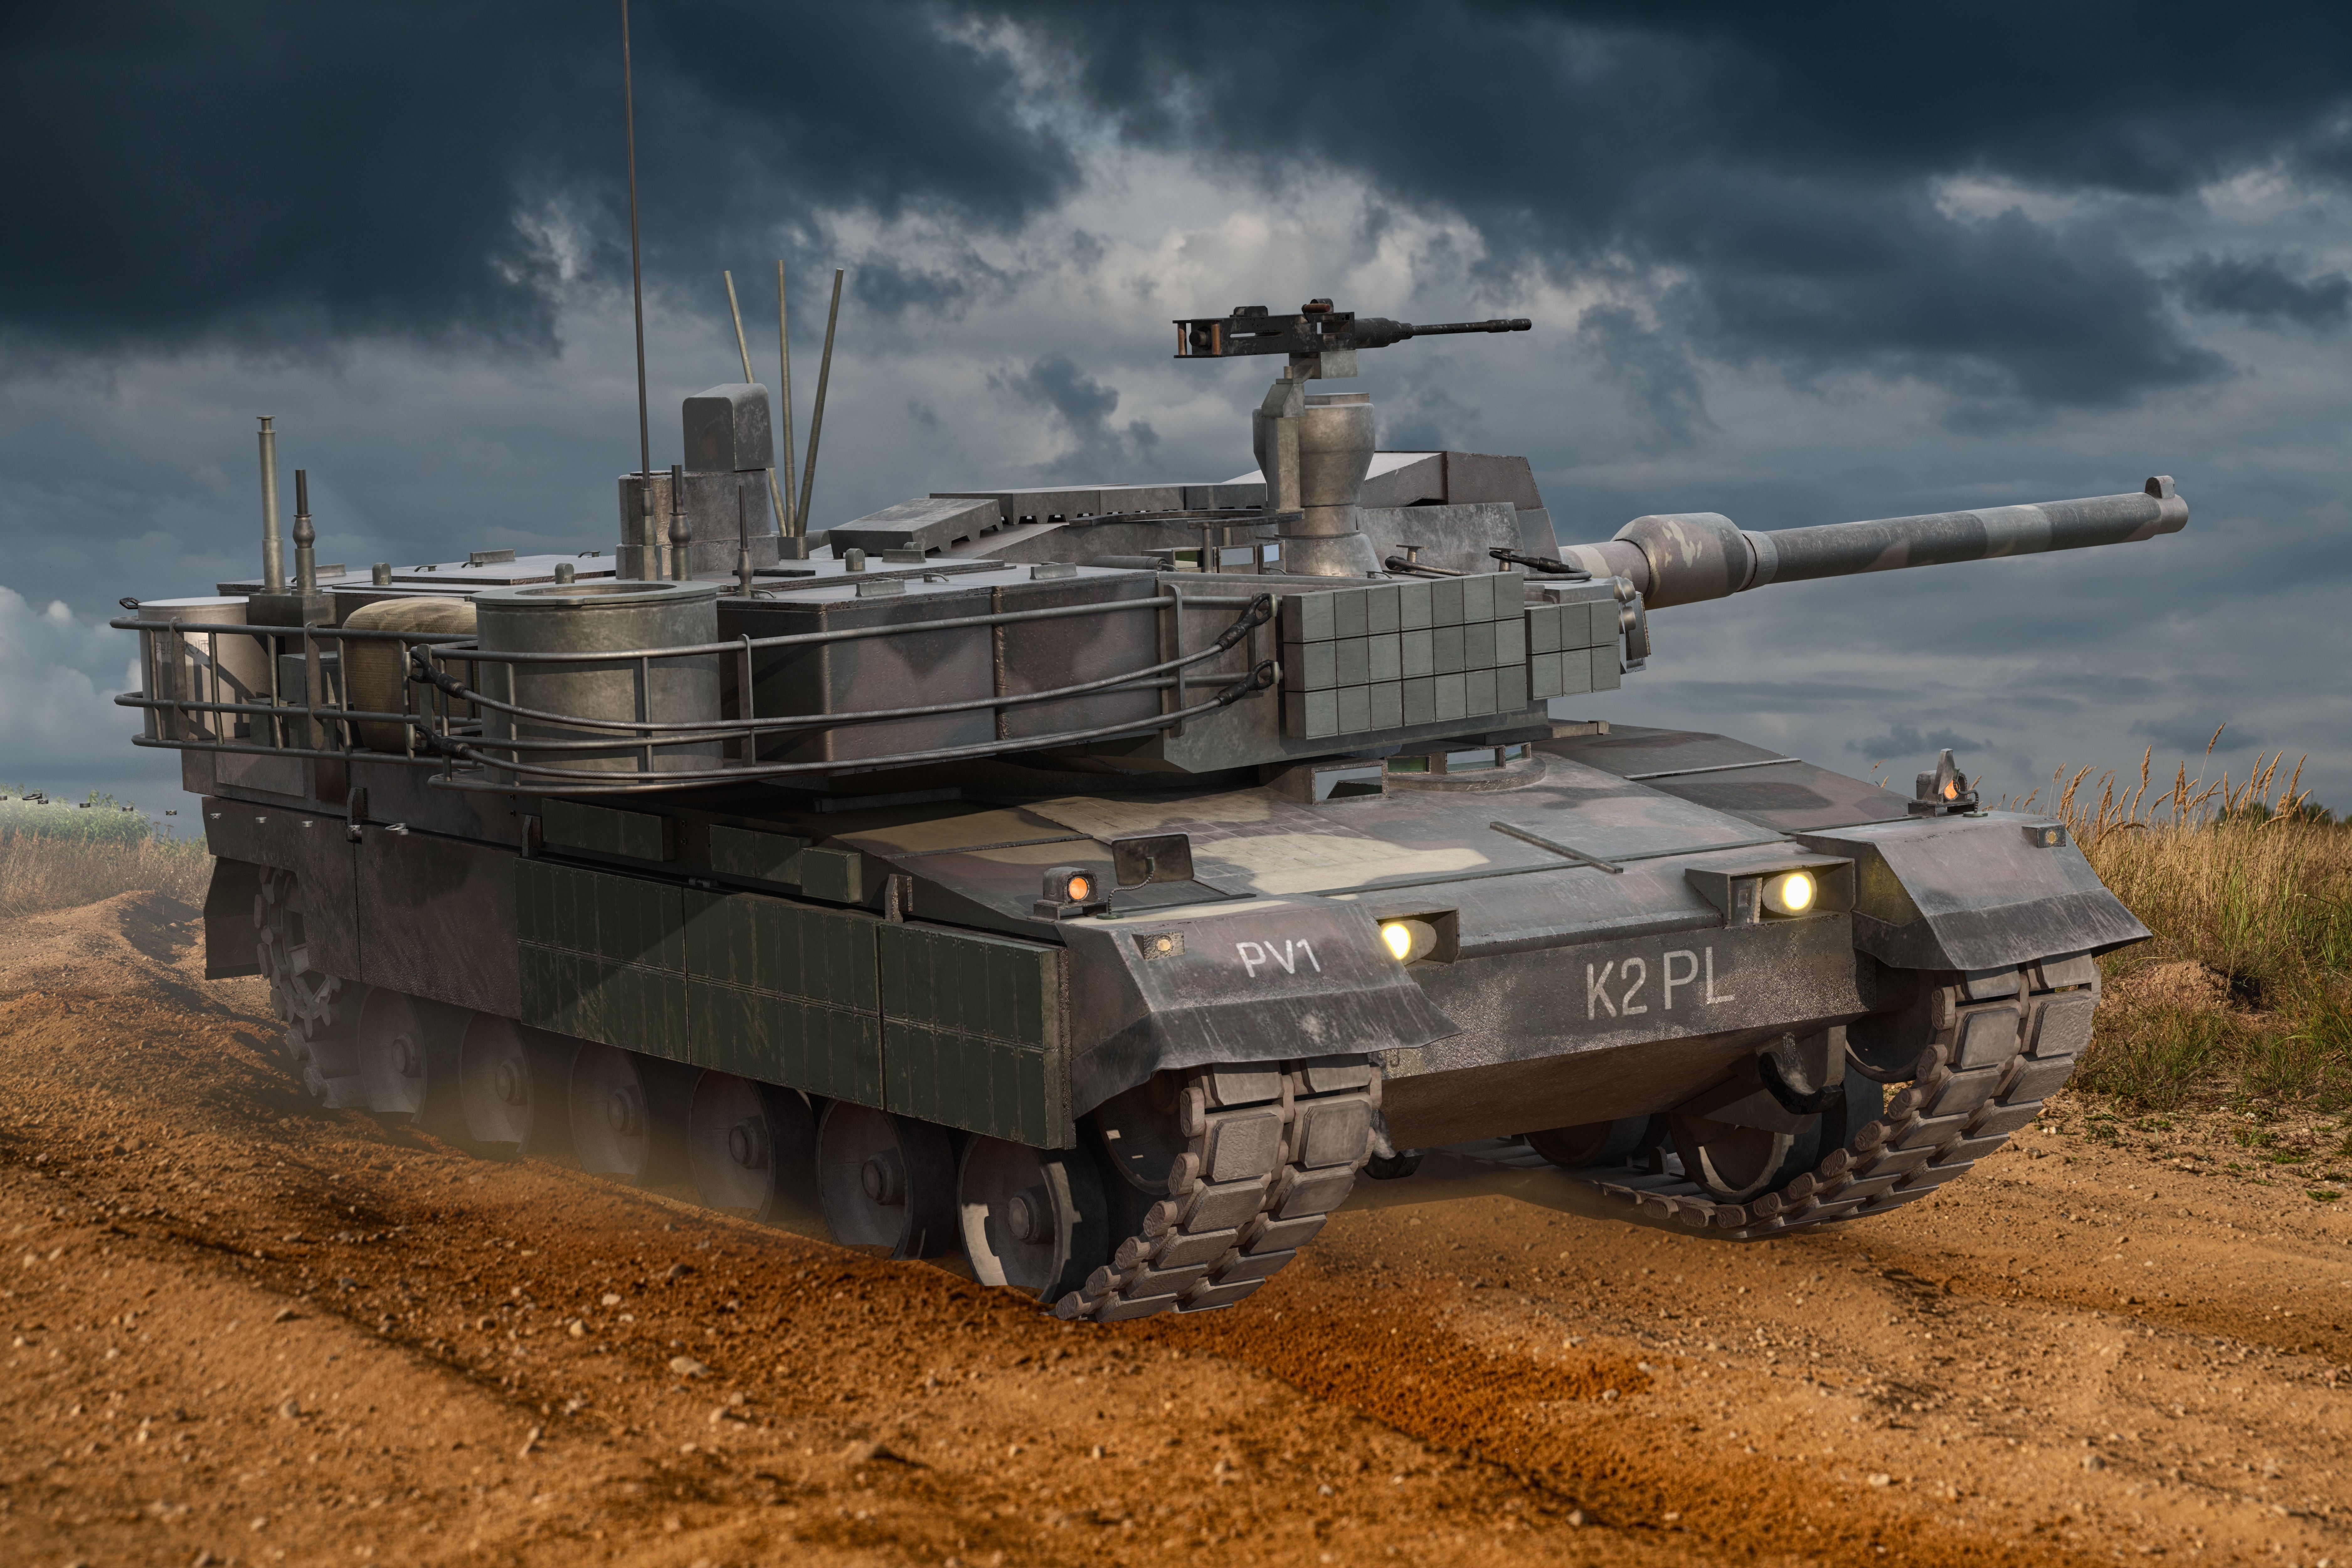
K2 Black Panther - South Korean basic tank. Hyundai Rotem concern has offered the Polish army a K2 model adapted to its needs along with full technology transfer

The Development of South Korea’s Tanks and the Global Competitiveness of the K2 Black Panther

by World and New World Journal

1. Introduction Since the Korean War, South Korea had long relied on U.S.-made tanks, but in the 1970s it launched a full-scale domestic tank development program under the principle of self-reliant national defense. As a result, beginning with the K1 tank, the country gradually increased its localization rate, and today it has fielded the highly advanced K2 Black Panther, placing itself among the world’s leading tank powers. However, when compared to major tanks competing in the global defense market, a comprehensive analysis is still required not only in terms of performance, but also in cost-effectiveness and export competitiveness. This study examines the evolution and localization of South Korea’s tanks, and analyzes the performance of the K2 in comparison with other global competitors to highlight its export potential and strategic significance. 2. Early Background: The Korean War – Early 1970s During the Korean War 1950-1953, North Korean forces launched their invasion spearheaded by the Soviet Union’s best-selling tank, the T-34. In contrast, South Korea did not possess a single tank at the time. The power of the T-34 allowed the North Korean army to advance rapidly in the early stages of the war. However, the arrival of U.S. ground forces changed the situation. The M24 Chaffee light tank was the first to be deployed, followed by the M4 Sherman medium tank, the M26 Pershing heavy/medium tank, and the M46 Patton medium tank, all of which overwhelmed the North Korean forces. Thanks to this reinforcement, the Nakdong River defensive line was held, and the tide of the war shifted in favor of the UN forces. Additionally, by late 1950, the British Army had committed its renowned A41 Centurion tanks to the conflict. After the war, in 1959, South Korea received the M47 Patton tank from the United States as part of its allied support policy and broader equipment modernization program. After the war, South Korea relied on U.S. assistance until 1970 to accumulate experience in operating and maintaining tanks. In particular, in 1966, when the M48 Patton tanks were provided by the United States, South Korea also received a Technical Data Package (TDP), which included key technology transfers alongside major upgrades. Through this, South Korea acquired comprehensive expertise in armor casting and welding, production processes, precision manufacturing and assembly, as well as quality inspection and testing. This foundation became a crucial stepping stone for the subsequent development of the Korean tank industry. 3. Development of the K1 Indigenous Tank: 1970s–1980s Under President Park Chung-hee’s policy of self-reliant national defense, South Korea launched the Republic of Korea Indigenous Tank (ROKIT) program in 1975 in cooperation with the United States. Following the signing of a memorandum of understanding in 1978, full-scale development began. The design direction was set to base the new tank on the form and performance of the U.S. Army’s latest third-generation tank at the time, the M1 Abrams. Chrysler Defense (now GDLS), the manufacturer of the M1, participated in the project, while South Korea’s Agency for Defense Development and Hyundai Precision (now Hyundai Rotem) worked together to create a smaller, terrain-optimized “Little Abrams” for the Korean Peninsula. In April 1984, two prototypes were produced, and after passing a series of tests, mass production began in 1985. The production K1 tank was armed with a 105 mm rifled gun and equipped with a 1,200 horsepower German MTU-series diesel engine, built with General Dynamics technology. A key feature was the adoption of a hydropneumatic suspension system, allowing adjustable ground clearance suited for Korea’s mountainous terrain. The tank weighed 51.5 tons, carried a crew of four, and a total of 1,026 units were produced between 1985 and 1997. During its service, the upgraded K1A1 variant was developed, featuring a 120 mm smoothbore gun, improved fire-control systems, and enhanced armor protection. A total of 484 K1A1s were produced between 1996 and 2008. Subsequent modernized versions, the K1E1 and K1E2, have ensured that the K1 series continues to serve as a core component of the South Korean Army’s armored forces. 4. The K2 Black Panther: 2000s – Present Beginning in 1996, the Republic of Korea Armed Forces acquired 68 T-80U tanks from Russia as repayment for an economic cooperation loan. At the time, the T-80U was Russia’s latest main battle tank, and for South Korean engineers, who had previously only worked with U.S.-made tanks, it provided a valuable opportunity to gain direct experience with a new model. The lessons learned from operating the T-80U contributed significantly to the later development of the K2 tank. After the Ministry of National Defense announced its next-generation tank program in 1992, a system concept study was carried out in 1995, followed by exploratory development in 1998. In 2003, full-scale system development began. By 2007, three prototypes were unveiled for operational testing and evaluation, and mass production was initially scheduled to begin in 2012. However, issues arose during the development of the domestic powerpack (engine and transmission). These included an engine protection temperature setting error, which failed to safeguard the engine from overheating, and insufficient cooling fan speed in the transmission at maximum output, which led to inadequate cooling. Despite multiple redesigns, persistent problems in performance and reliability testing delayed deployment. As a result, the first production batch of 100 K2 tanks was equipped with Germany’s MTU engines and RENK transmissions instead of the domestic powerpack. These vehicles began delivery to the ROK Army in April 2014. By September 2014, the domestic engine had passed the Defense Acquisition Program Administration’s evaluation, and the second batch of 106 tanks and the third batch of 54 tanks were produced with a “hybrid powerpack”—a Korean-made engine combined with a German transmission. Starting with the fourth production batch, SNT Dynamics’ domestic transmission was successfully integrated, completing full localization of the K2 powerpack. Unlike its predecessor, the K1, which had been developed under the leadership of General Dynamics and relied heavily on U.S. components, the K2 Black Panther is a fully indigenous South Korean tank. With domestically developed engines and transmissions, it achieved a high localization rate, giving South Korea independence from U.S. and German export restrictions and allowing greater freedom in operating and exporting its tanks. As South Korea’s most advanced tank, the K2 incorporates cutting-edge technologies that set it apart from its predecessors. These include a 120 mm smoothbore gun, an active protection system (APS), an autoloader, and stealth features, delivering superior mobility, protection, and firepower. Today, it stands as a core asset of the South Korean Army. Specifications (K2 Black Panther):Crew: 3Weight: 55 tonsEngine: Doosan Infracore DV-27K diesel engineTransmission: SNT Dynamics EST15K automatic transmissionMain Gun: Hyundai WIA 120 mm smoothbore CN08Fire Control System: South Korean domestic technologyArmor: Korean-developed composite armor  5. Timeline of South Korea’s Tank Development: From U.S. Aid to the K2 The introduction and development of tanks in the ROK Army have been organized in a chronological timeline with images. This timeline is designed to provide a clear overview of the entire progression — from U.S. aid tanks, to tanks acquired from Russia, and finally to the development of indigenous Korean tanks.   6. K2 vs. Regional Main Battle Tanks — Performance Comparison Tank performance can be compared across four key categories: Mobility, Firepower, Protection, and Sensors & C4I. MobilityComponents: engine & transmission (powerpack), suspension, roadwheels, sprockets, tracks, and fuel systems.Role: determines speed, acceleration, cross-country mobility, and operational range. Maintainability (ease of maintenance and access) is also included here. FirepowerComponents: main armament (gun) — barrel and mantlet, stabilization system, autoloading/manual loading systems, coaxial and anti-aircraft machine guns, ammunition stowage.Role: defines ability to defeat enemy armor and other targets, hit probability (integrated with the fire-control system), and ammunition variety (e.g., APFSDS, HE).ProtectionComponents: baseline composite/steel armor, explosive reactive armor (ERA), active protection systems (APS), smoke generation, fire suppression and NBC protection, and crew survivability compartments.Role: protects crew and systems from penetration, fragmentation, anti-tank weapons, and environmental threats.Sensors & C4I (Command, Control, Communications, Computers, and Intelligence)Components: fire-control system (FCS), thermal and night sights, laser rangefinder, communications suites, electronic warfare and laser warning receivers, and power-management systems.Role: responsible for target acquisition, firing accuracy, and networked combat — i.e., information sharing with friendly forces.Below is a comparison of the K2 and the region’s current main battle tanks.    The K2 Black Panther is regarded as a world-class main battle tank, demonstrating well-balanced excellence in mobility, firepower, protection, and electronic systems compared to neighboring countries’ tanks. 7. South Korea’s Tank Export Outlook and Key CasesWhile exports of the K1 tank were restricted due to U.S. technology regulations, the K2 tank—developed with fully indigenous Korean technology—became eligible for overseas sales. In 2022, South Korea successfully signed a contract with Poland, and negotiations are currently underway with countries in Europe, the Middle East, and Africa, signaling the expansion of Korean tanks into the global defense market. 7.1. Turkish Joint Development of the Altay Tank Based on the K2 (USD 540 million)In 2007, South Korea signed a design support and technology transfer contract with Turkey for the development of the Altay main battle tank. Under this agreement, South Korea transferred several core technologies derived from the K2 tank, including:- 120 mm CN08 smoothbore gun technology (Korean-produced main gun)Advanced armor and composite equipment design consultation and production support- Powerpack (engine + transmission) technology transfer and testing: the Altay successfully completed durability trials with the HD Hyundai Infracore engine and SNT Dynamics transmission The Altay is scheduled to enter full-scale mass production in 2025, with an initial production run of 250 units and a long-term goal of building up to 1,000 tanks. 7.2. K2 Export to Poland: First Batch of 180 Units (USD 3.4 billion), Second Batch of 180 Units (USD 6.5 billion) In 2022, the K2 tank was selected by Poland over strong competitors such as Germany’s Leopard 2A7 and the U.S. M1A2 Abrams. The key factors behind this successful export were as follows: - Rapid delivery and phased supply: South Korea demonstrated its ability to deliver tanks within a very short timeframe. Following the 2022 contract, the first batch of 10 units was delivered within the same year. By contrast, competitors faced production line bottlenecks, raising concerns over delivery delays. - Modern design with European upgrade potential: The K2 features a 120 mm 55-caliber smoothbore gun, an autoloader, an active protection system (APS), and hydropneumatic suspension—technologies equal to or in some cases more advanced than those found in Europe’s latest MBTs. Moreover, South Korea promised to develop a localized version, the K2PL, through joint development with Poland, tailored to Polish requirements. - Local production and technology transfer: South Korea offered local production of the K2PL, guaranteeing the participation of Polish defense industries, along with technology transfer, industrial cooperation, and the prospect of using Poland as a base for future exports. - Cost competitiveness: Despite being a state-of-the-art tank, the K2 is relatively more affordable than the M1A2 or Leopard 2A7. Maintenance and sustainment costs are also projected to be lower than those of European tanks, giving the K2 a strong reputation as a “cost-effective MBT” with excellent value for performance. - Tactical versatility and advanced systems: Equipped with an autoloader, hydropneumatic suspension, and advanced smart fire-control systems, the K2 offers outstanding adaptability across diverse operational environments, including mountainous terrain, urban warfare, and extreme cold.Through this deal, South Korea and Poland established a relationship that goes beyond a simple arms sale, building long-term defense industry partnership and mutual trust. Potential export destinations for the K2 include the Czech Republic, Slovakia, Romania, Saudi Arabia, Oman, Egypt, Morocco, and India. 8. Comparison of Tanks from Export Competitor Nations South Korea’s K2 tank has attracted global attention for its outstanding performance, but the international tank market is already dominated by several major players.This chapter analyzes and compares the leading tanks that compete with the K2, while also examining each country’s export competitiveness.   The K2 Black Panther, while incorporating cutting-edge technologies, is lighter than many Western main battle tanks, resulting in relatively lower sustainment costs. It is therefore widely regarded as a cost-effective, well-balanced tank. The cost of a tank varies greatly depending on its design and configuration, but if we break down the production cost (manufacturing, components, and assembly) into four categories, the estimated shares are as follows:- Protection: 30–40%- Firepower: 20–30%- Mobility: 15–25%- Electronics & C4I: 15–25% The actual share, however, depends on specific factors. For example, the use of advanced armor materials (composite/uranium) or the inclusion of an Active Protection System (APS) significantly increases protection costs. Similarly, specialized gun and ammunition systems (such as a 120mm smoothbore, autoloader, or advanced munitions) raise firepower costs. Integration, testing, and safety features greatly affect electronics costs, while options like autoloaders, high-performance thermal sights, and networked systems can heavily influence the final balance. Other important factor is Lifecycle Perspective (Unit Cost vs. Total Life-Cycle Cost), which can be defined as below.- Procurement: About 20–30% of total life-cycle cost (highly variable)- Operations & Support (O&S): 60–70% — dominated by fuel, maintenance, spare parts, and maintenance personnel costs- Upgrades & Depreciation: 10–20% In other words, the long-term operation and maintenance costs take up a much larger share than the initial procurement cost of a tank.Below is a comparison table of modern main battle tank costs: unit acquisition cost, annual sustainment cost, and 30-year life-cycle cost (procurement + sustainment).*The sustainment cost for China’s Type 99A and Russia’s T-90M is an estimate.   9. Conclusion This study has systematically examined the evolution and localization of South Korea’s tanks, and verified the level of their advancement through performance comparisons with leading global competitors. In particular, the K2 has demonstrated balanced capabilities in mobility, firepower, protection, and electronic command-and-control, supported by advanced technologies and a high degree of localization. At the same time, it offers superior cost-efficiency in sustainment and operational expenses compared to heavier Western MBTs. This makes the K2 not only a key asset for strengthening domestic defense, but also a competitive and cost-effective platform in the global arms market. Taken together, these findings suggest that South Korea’s tanks have progressed beyond being a mere symbol of self-reliant defense, and are now positioned to expand exports and build long-term strategic partnerships worldwide.