Subscribe to our weekly newsletters for free

Subscribe to an email

If you want to subscribe to World & New World Newsletter, please enter
your e-mail

Energy & Economics
Chinese Yuan on the map of South America. Trade between China and Latin American countries, economy and investment

Ahead of the curve: Why the EU and US risk falling behind China in Latin America

by Ángel Melguizo , Margaret Myers

한국어로 읽기 Leer en español In Deutsch lesen Gap اقرأ بالعربية Lire en français Читать на русском As Beijing’s investment approach to Latin America focuses on industries of strategic importance, the EU and US will need to contend with growing Chinese competition China is pouring less foreign direct investment (FDI) into Latin America. But while this may seem like a sign of Beijing’s disinterest in the region, data suggests that Chinese companies are simply recalibrating, not retreating. In doing so, they are becoming important players in sectors key to Western interests: critical minerals, fintech, electric vehicles, and green energy. While the European Union and the United States have long been top investors in Latin America, increased competition with Chinese investment now jeopardises their interests in the Latin American industries that will become most crucial to the digital and green transitions. The number of Chinese projects in Latin America grew by 33 per cent from 2018-2023, compared with the previous five-year period of 2013-2017, even as the total value declined. In other words, Chinese companies are making more investments in the region but are pursuing smaller-scale projects on average. These investments are also more focused on what China calls “new infrastructure“ (新基建), a term which encompasses telecommunications, fintech, renewable energy, and other innovation-related industries. In 2022, 60 per cent of China’s investments were in these frontier sectors, a key economic priority for the country. Beijing also views smaller projects in these industries as incurring less operational and reputational risk, especially compared to some of the large-scale infrastructure investment projects often associated with the Belt and Road initiative. Like China, the investment priorities of the G7 grouping – particularly the US and the EU – are centring on critical minerals, fintech, electric vehicles, and green energy as they aim to grow and reinforce existing economic and political partnerships in Latin America. However, both the US and the EU risk falling short of China’s investment strategy in the region. The US has signalled want for greater economic engagement with the region, especially in sectors of strategic interest. However, to date, US efforts to compete with China remain largely focused on building US domestic capacity in these strategic sectors, even as some US companies, such as Intel, are increasingly focused on including regional partners in their supply chains. Some see opportunity for Latin America in Joe Biden’s landmark legislation, the Inflation Reduction Act (IRA), which is aimed at incentivising the energy transition while also de-risking critical supply chains. For example, certain countries in the region may benefit from preferential market access for their lithium or other key inputs to new energy and technology supply chains. However, the reach of the IRA – which remains a largely domestic policy – does not stretch as far as China’s current investment reshuffle. The Americas Act, announced by members of Congress in March could generate promising new investment opportunities for the region, as it encourages US companies and others to move their operations out of China, to which Latin America stands as a promising replacement. But Americas Act reshoring would primarily incentivise textiles and potentially medical equipment manufacturing, with less overall focus on the range of “new infrastructure” industries that China is prioritising. Chinese interests in information and communication technologies reveal a similar story. While the US has focused its policy on 5G equipment sales, China is undertaking a process of vertical integration in Latin American tech sectors that will dramatically boost its competitiveness. For instance, Chinese company Huawei is rapidly expanding its focus to include data centres, cloud computing, cybersecurity, and other services, especially in Argentina, Brazil, Chile, Colombia, Mexico, and Peru. (Computing accounted for a sizable 41 per cent of total Chinese information technology investment in the region between 2018 and the first half of 2023.) At the same time, Global Gateway, the EU’s proposal for a global investment initiative is yet to reach its potential in the region. Brussels is looking to be Latin America’s partner of choice by building local capacity for making batteries and final products like electric vehicles, as European Commission president Ursula von der Leyen noted last year. Yet even as the EU signals renewed commitment, China is becoming increasingly dominant in the electric vehicle market in Latin America and other regions. China surpassed the US in electric vehicle sales in 2023, with Chinese companies accounting for 45 per cent of total global sales and three times that of Germany’s. What is more, China has invested $11 billion in lithium extraction in the region since 2018, as part of a bid to control a third of global lithium-mine production capacity. Meanwhile the EU has secured some access to lithium as part of trade deals with Chile, alongside other nations, but this pales in comparison to what will be required to fuel the future of EU battery production. Latin America as a whole accounts for an estimated 60 per cent of the world’s lithium reserves. Based on its current levels of engagement in the region, the EU risks falling short of lithium, stalling its battery production and subsequently, its electric vehicle sales, just as China advances in this field. The window is closing for the EU, the US, and other partners looking to both maintain market share and compete with China in these Latin American industries, despite still-high rates of US and EU investment in and trade with the region. Indeed, US automakers increasingly see Chinese competition across the globe as an “extinction-level event.” Ensuring competitiveness in “new infrastructure” and related sectors will require a continuous commitment by partners to building and supporting project pipelines, and to delivering products and services at price points that can compete with China’s subsidised offerings. Both the EU and the US remain critical economic partners for Latin America and are contributing in ways that China is not. Still, complacency risks allowing China to take the lead in emerging industries in the region, some of which weigh heavily in the EU’s green and digital transformation. To protect their own future industries, the EU and the US need to first take a longer look at Latin America’s – especially as China vies for a dominant position.

Energy & Economics
The concept of a fragile, vulnerable, unstable world order.

World Order Transformation: Economy, Ideology, Technology

by Aleksandr Dynkin

한국어로 읽기Leer en españolIn Deutsch lesen Gap اقرأ بالعربيةLire en françaisЧитать на русском The concept of a multipolar (or polycentric) world order [1] was first coined by Academician Yevgeny Primakov in 1996 [Primakov 1996]. Like everything new, it was not immediately accepted, but ultimately became a significant contribution to both domestic and world theory of international relations, offering a compelling alternative to Western approaches, particularly the one proposed in Samuel Huntington’s The Clash of Civilizations [Huntington 1993]. It informed the idea of trilateral cooperation between Russia, China and India, implemented by Primakov and later embodied in the BRICS group. By now, the idea of multipolarity has been recognized in global political science, has entered the conceptual framework and the language of international diplomacy and is used in Russia’s doctrinal documents. In 2015, we proposed the scenario of a new bipolarity [2] as one of the possible trajectories for global development. Today, many scholars, both Chinese and American, [3] suggest that China-centric and U.S.-centric poles are emerging. This article discusses the “multipolarity — new bipolarity” dichotomy. Long Global Macro-Transformations World history shows that a new world order typically emerges after the end of a major war (see Table 1). Table 1. International system (world order)    Source: systematized by A.A. Dynkin, IMEMO RAS Europe was usually the “kitchen” where the world order was cooked. Take the last 200 years. After the end of the Napoleonic Wars, the Concert of Europe emerged and lasted for 100 years. The century-long stability of that system could be explained by the homogeneity of the political organization of its guarantor states. All members of the Concert of Europe were monarchies. World War I produced the Versailles system, which lasted only 20 years. One of the reasons for its short life was the exclusion of the Soviet Union, Germany and China. The Yalta-Potsdam system was formed by the victors in World War II. Its guarantors were the “Big Three” powers—the Soviet Union, the U.S. and the UK—along with France and China. The three defeated powers—Germany, Japan and Italy—were discriminated and disenfranchised. This system existed for 45 years and was initially thought to be polycentric, but quickly degenerated into a bipolar order, and the Cold War commenced. With the collapse of the Soviet Union and dissolution of the Warsaw Pact, the system became unipolar, dominated by the West, primarily the U.S. It disregarded Russia’s interests and, from 2018 onward, began discriminating against China as well. February 2022 can be considered the formal date of the unipolar world’s demise. However, today’s predictions suggest it will take at least 10 years before the new post-unipolar system becomes stable. The economic center of gravity is a spatial indicator of the economic strength of states, borrowed from physics. To put it simply, this is a geographical point of equilibrium for GDP, trade and investment flows of different countries. Figure 1 shows a map of how the world’s economic center of gravity shifted for over a thousand years. It appeared in Central Asia, on the territory of the Ghaznavid Empire (modern-day Afghanistan). The center then migrated northwest, while the devastation in post-war Europe forcefully pushed it (within just 10 years) to the West, toward Greenland. Then it turned east again. The sharpest shift, to the southeast, occurred in 2000–2010 and is associated with the rise of China. The economic center of gravity has almost returned to the same meridian but remained more than 2,000 km north of the starting point, which indicates a return to the millennial balance of economic power between the West and the East. Figure 1. “Journey” of the three-dimensional economic center of gravity    Source: Dobbs R., Remes J., Manyika J. et al. Urban world: Cities and the rise of the consuming class. McKinsey Global Institute, 2012. https://www.mckinsey.com/featured-insights/urbanization/urban-world-cities-and-the-rise-of-the-consuming-class. Statistic calculations by IMEMO RAS for 60 years of peace (1960–2021) indicate the stability of the center’s latitudinal (horizontal) position. This suggests a relatively consistent proportion of GDP production by the countries in the Global South and Global North, under the economic leadership of the Northern Hemisphere. The shift to the East has also been clearly confirmed. According to our projections up to 2050, the future position of the globe’s center of economic activity will lie on the border of India and China. This method of analysis reveals a high level of inertia in time and geographic monotonicity of changes in the balance of economic power of states. It also shows that wars can drastically disrupt the natural course of events. The center of gravity method can also be applied to the arsenals of strategic and tactical weapons (see Figure 2). For example, during the Cuban Missile Crisis, the U.S. had a huge advantage, but then there was a clear pivot to the northeast—the creation of superior nuclear capabilities in the Soviet Union. With the onset of arms control in 1993, a reversing loop emerged, heading southwest. This was followed by a curve to the east with an implied southward inclination, which reflects the growing nuclear stockpiles of India, Pakistan, North Korea, and the rapid buildup of strategic and tactical nuclear forces in China. The military center of gravity follows its economic peer with a lag of 20 years, reflecting the geopolitical ambitions of Asian powers. These interpretations also clearly demonstrate the end of unipolarity and point to the rise of multipolarity. Figure 2. Movement of the nuclear center of gravity Source: calculations by K.V. Bogdanov, Center for International Security at IMEMO RAS, based on the data from the Bulletin of the Atomic Scientists. https://thebulletin.org/nuclear-notebook/. Technology. Politicians tend to be techno-optimists. Barack Obama predicted that 3D printing would transform the entire world. [4] George W. Bush promised that decoding the human genome would revolutionize medicine. [5] All false starts. Economists traditionally measure the rate of technological progress (TP) using the total factor productivity (TFP) index. To put it simply, this is the part of economic growth driven not by an increase in inputs—labor and capital—but rather by improvements in the efficiency of their use. Technological progress means not only the generation of new scientific and technological ideas but also their mass replication. Without economic validation of the impact of wide dissemination of innovations, scientific or technological achievements remain in history as brilliant breakthroughs with only local economic effects, giving rise to journalistic generalizations at best, such as the “Fourth Industrial Revolution” or “the sixth techno-economic paradigm.” Statistical metrics rely on data of technologically advanced nations, while catching-up countries have room for growth by approaching the TP frontier, i.e. adopting and improving existing ideas and technologies. Technological leaders spend more resources pushing the TP frontier, while those catching up can accelerate at lower costs, effectively staying in the “wind shadow” of the leaders. The TFP index growth rate has been steadily declining in developed countries for many years, but this has been especially conspicuous since the mid-2000s. Today, the growth is below 1.5% and even 1% per year (see Figure 3). Figure 3. Average annual growth of total factor productivity, % Source: calculations by IMEMO RAS based on the data from the International Productivity Monitor. No. 38, Spring 2020. http://www.csls.ca/ipm/ipm38.asp#:~:text=Martin%20Neil%20Baily%2C%20Barry%20P.%20Bosworth%20and %20Siddhi%20Doshi%0ALessons%20from%20Productivity%20Comparisons%20 of%20Germany%2C%20Japan%2C%20and%20the%20United%20States%C2%A0; Innovative China: New Drivers of Growth. World Bank Group, and the Development Research Center of the State Council, P.R. China. 2019. Washington, DC: World Bank. https://doi.org/10.1596/978-1-4648-1335-1. License: Creative Commons Attribution CC BY 3.0. https://documents1.worldbank.org/curated/en/833871568732137448/pdf/Innovative-China-New-Drivers-of-Growth.pdf. A similar pattern of dramatic TFP deceleration was observed in China. The consensus interpretation of these figures is that the main effects of the Third Industrial (i.e., computer) Revolution have largely been exhausted, and no new general-purpose breakthrough technologies (such as electricity, internal combustion engines, or computers and mobile communications) have emerged. However, it seems that the intellectualization of technologies and approaches to project management, as well as informatization, simply do not fit into the traditional factor-based view of progress that was established many years ago. The scale of knowledge is growing, new professions are springing up, the role of emotional intelligence and cognitive functions is increasing. All this dramatically changes the structure of capital assets (see Figure 4). From the beginning of the 21st century and until the 2008 crisis (2000–2007), equipment accounted for over 50% of the increase in capital’s contribution (investment) to output growth, whereas in 2019–2021, almost 63% of this increase was attributable to intellectual property assets. This result of our research suggests a refocusing of technological progress from final products to intellectual technologies, enabling the production of a range of innovative goods and services tailored to highly segmented demand. Figure 4. Transformation of the capital structure in the U.S. private sector Source: Total Factor Productivity for Major Industries—2022. U.S. Bureau of Labor Statistics. https://www.bls.gov/news.release/archives/prod3_03232023.htm. There are now hopes that the pace of technological progress may accelerate due to the development of artificial intelligence (AI) technologies, which will spark a new industrial revolution. An indirect sign of its imminence is the sharp rise in the rate of business births and deaths in the U.S. economy in 2020–2022. [6] The spillover of labor from companies that are losing efficiency to corporations with increasing market shares has also accelerated. These are some sort of leading indicators that suggest the structural results of TP are approaching. Similar developments occurred 30 years ago, on the cusp of the computer revolution. The above-mentioned intellectualization of fi ed capital, where trusted AI will be applied, adds credibility to these hopes. In addition, AI is one of the critical areas of technological sovereignty. It is no coincidence that Vladimir Putin described AI as “crosscutting, universal and essentially revolutionary technology.” [7] The Russian President announced the preparation of a new edition of the National AI Development Strategy and a respective decree. I believe that this prioritization is justified. China’s experience in the semiconductor race is a good model to be emulated (see Figure 5). Its distinguishing feature is the focus on companies as drivers of development, with massive, cumulatively growing state support. Figure 5. Focusing on China’s priorities (nanometer chip race) Source: Systematized by I.V. Danilin, IMEMO RAS The U.S. strategy of curbing technological development of Russia (in all areas) and China (in semiconductors, artificial intelligence and quantum computing and electric cars) leads to stiff competition in high technology, which is fraught with fragmentation, diversification of technical standards, legal norms and rules. And this is another argument in favor of a new bipolarity. Demographic processes. According to UN projections, by the middle of the 21st century, Russia will drop from its current 9th place to 14th in terms of population, while remaining the most populous country in Europe. [8] A more significant problem for Russia is population aging. The proportion of elderly people, who are typically not part of the labor force, is increasing. Japan, Spain and Italy are leading this process today, but neither China nor India will be spared. Nigeria appears to be the only major country where population and the share of young people will continue to grow until the end of the 21st century. As of December 2023, one in 10 people worldwide was aged 65 or over, with health spending taking up 10% of global GDP. [9] In this context, the importance of medical technologies cannot be overstated, as they can extend not only people’s life expectancy but also the duration of their healthy and socially active life, thereby easing labor market pressures. Needs always steer technological progress toward overcoming economic growth constraints tied to the scarcest resource in any given historical period. A serious risk associated with the problem of aging is a slowdown in innovation, since it is people under 40—the age group that will shrink throughout the 21st century—who are the primary drivers and consumers of innovation. So far, this risk has been mitigated by the large youth cohorts in China and India. This is why these two nations are experiencing almost exponential growth in patenting, massive reengineering and, consequently, in middle-class numbers. Demographics give India an edge until around 2060, which is already evident in the growth rates of Indian economy. Combined with the influx of hi-tech investments and the contribution of the Indian diaspora, India has good prospects, making its position crucial to the future architecture of the world order, regardless of how it evolves. The U.S. understands this and has been figuratively “clinging” to this nation for the past 20 years. I believe that the Russian Academy of Sciences should significantly bolster scientific and educational ties with India and its dynamically developing neighbors in Southeast Asia—Vietnam, Malaysia and Indonesia. The anticipated tension in the global market of new generations of innovators aggravates inter-country competition for this scarcest resource. I think that the international reputation of the Russian Academy of Sciences is a powerful tool to attract and retain young people and foster their creative motivation. We should reassert this as we celebrate the 300th anniversary of the Academy of Sciences. Ideology. Dirigisme [10], or statism, is the main trend in both economic theory and economic policy of the West. A pivot to a more state-controlled economy began with the disappointing outcomes of the Washington Consensus, which aimed to guide post-socialist countries from planned to market economies. The 2008–2009 financial crisis cemented the trend toward statism, and the COVID-19 pandemic elevated it to unprecedented proportions. In the U.S., Democrats are among the most vocal proponents of greater government intervention in all spheres of life, but they are not alone. Republicans are also actively advocating industrial policy, repudiation of free trade, as well as strict control over Big Tech, among other measures. The popularity of the so-called cultural Marxism is on the rise. [11] Its origins go back to the critical theory of the Frankfurt School (H. Marcuse, E. Fromm and others). These ideas are moving from the realm of ideological and theoretical confrontations into political activism. For example, the leaders of the BLM movement publicly self-identify as “trained Marxist organizers.” The essence of the strategy inspired by “cultural Marxism” is the rejection of direct political struggle on the barricades, since the proletariat has been “bought off by the bourgeoisie and is no longer capable of anything,” and the ranks of the classic proletariat are rapidly thinning. The direction of social change is set, on the one hand, by intellectuals with personal power and, on the other hand, by marginalized groups seeking to assert their “right to identity.” The strategy of activists who form this paradoxical combination of intellectuals and marginalized individuals is the creeping takeover of the main institutions of power and society by planting “correct” ideas in the mass consciousness. In the U.S., the fighters for political correctness have already hijaked the school system, university campuses, major media outlets and the entertainment industry (Hollywood). Civil servants are forced to take courses in critical race theory, which postulates not only the socially constructed nature of race and the recognition of systemic racism [Delgado, Stefancic 2017: 45] but also a sense of guilt in one part of society toward another. This, in turn, allegedly requires addressing moral and material injustices by organizing public life in line with such an ideology. Similar concepts are being pushed into public discourse as well. It is already dominated by the ideas of radical feminism, cancel culture, anti-systemic racism and postcolonialism, the fight against global warming and the green agenda, which claims to be universal and non-negotiable. As a result, the energy transition is motivated more by ideology than by the comparative market efficiency of energy supplies. Different environmental-political discourses—eco-nationalism, eco-imperialism and green growth—are competing in shaping the green agenda, eroding the attractiveness of the dominant sustainable development model. Another universal weapon in fighting any dissent is political correctness. Large corporations, government agencies and universities are developing and implementing strategies to promote DEI (Diversity, Equity, and Inclusion) principles, which are nothing but tools of ideological control over employees. Universities are required to fi reports on their compliance with such principles and efforts to promote them, which causes mounting criticism as they violate academic freedom and cultivate ideological conformity. [12] However, ideological censorship has already taken deep root in various spheres of public life, and questioning its compatibility with democracy is deemed politically incorrect. Revising cultural norms has become a cultural norm in and of itself, deepening divisions in modern polarized societies, primarily in the U.S., but also in Old Europe [Semenenko 2023: 27-35]. Another curious phenomenon is associated with the new agenda. In the 20th century, the left championed progress, advocating faster economic growth, rapid technological advancement and better social welfare. Now the ideas of zero or even negative growth and post-growth are popular among them. [Buchs, Koch 2017: 218]. Such ideological narratives exacerbate the question of how to treat the poor countries of the South, but also their own poor: the welfare state for all no longer fit into this agenda. On the contrary, it becomes a selective tool of backing the “right” minorities. This creates a breeding ground for stronger positions of populist forces. Such contradictory internal political processes distort public consciousness as well as domestic and foreign policy decision-making. The new elites are extremely ideologized. The U.S. political system is becoming less effective at regulating the economy. Two rating agencies, Standard & Poor’s and Fitch Ratings, have downgraded the U.S. credit rating to AA+ from the top mark of AAA. In November 2023, Moody’s lowered its outlook on the U.S. credit rating to “negative” from “stable.” All three agencies agree on the main reason for the downgrade: the growing dysfunctionality of the political system. In foreign policy, the U.S. has withdrawn from 16 major international treaties and agreements on arms control, global trade, climate and the Arctic since the beginning of the century [Dynkin 2020]. In other words, the unipolar world order with its unbridled appetite for expansion has brought the world into a zone of extra-high risks. And the paradigms that are dominant in the West have proven incompatible with either Russian or Chinese value-oriented political projects. Therefore, the ideological sphere will inevitably see increased confrontation, marking another step toward bipolarity. IMEMO RAS researchers have repeatedly warned about the West’s miscalculated strategic hopes: 1) that Russia would face an economic catastrophe because of an unprecedented sanctions war in modern history; 2) that the unipolar world order would remain unchallenged; 3) that a global blockade of Russia’s export-oriented economy would be feasible. And we were not the only ones who made these warnings. In response, we only heard propagandistic clichés like “a gas station masquerading as a country,” “a regional power” and “Russia is isolated with its economy in tatters”. This kind of “expertise” led the Washington establishment to believe that Russia is a “declining power” whose strategic interests could be safely neglected. This “strategic lunacy” is a consequence of a universalist mindset—a product of the West’s political experience and culture, which tends to elevate Anglo-Saxon and European historical tradition to absolutes—and of a failure to understand the shifts in the balance of power in the 21st century. Today, Russia is the world’s fourth-largest economy by purchasing power parity (PPP), while the top fi e global economic powers include three BRICS nations and none from the blooming “garden” of Josep Borrell, the EU foreign policy chief who has recently been fired. Now a new narrative has been launched into the propaganda orbit: “Russia is about to attack Eastern Europe.” The logical gap between the image of a declining power and that of an “aggressive bear” is conveniently ignored. This primitive, one-dimensional perception of complex non-linear processes can only lead to disappointment—just as it did when the West lulled itself into believing that Chinese reforms would eventually lead to political pluralism. As a result, the West has an inexhaustible stream of surprises. It appears that their experts are increasingly out of touch with Russian (and any other non-Western) realities. Figuratively speaking, they are staring into a distorting rearview mirror constructed by their own rhetoric and propaganda. But the main real surprise was the fantastic resilience of the Russian economy. I dare say that no other economy in the world, not even China’s, could withstand such aggressive pressure. The high resistance of the Russian economy to external shocks can be explained by three fundamental reasons. First, it is the result of difficult, sometimes agonizing institutional and structural reforms. These efforts have ultimately produced a self-sufficient, adaptive and highly diversified market economy. Second, the crisis of 2022 was the fifth (!) in the history of post-Soviet Russia. The government, federal regulators and the Bank of Russia have accumulated hard-earned professional experience in crisis management and counter-cyclical strategies. The same can be said about business. Our economic entities have demonstrated time and again that there are always more effective solutions than there are problems. Finally, the West miscalculated its ability to isolate our economy. The dual containment of Russia and China, in fact, only strengthens ties between the BRICS member states. Transformations of the 2020s. The first half of the 2020s has fi y buried what was once known as “European security.” It is impossible to glue this “broken cup” back together without Russia. The unwillingness of the Ukrainian side and the West to stop the armed conflict at its very beginning, the dangerous escalation, NATO’s constant violation of its own “red lines” and the accession of Sweden and Finland to the North Atlantic Alliance are all symptoms of the European security system transforming into a transatlantic one. Meanwhile, the Eurasian security system is taking shape. The outcomes of Russian President Vladimir Putin’s visit to China hint that the “political East” is starting to form, if not as an alternative to the long-standing “political West,” then at least as an equal partner. Without considering its interests, any debate about “rules-based” global security will be mere fantasy. Indian Prime Minister Narendra Modi’s first visit to Moscow after his recent reelection is in the same vein. Of course, geography cannot be changed, and Russia has been and will remain a European power. However, it is also the geographic center of Eurasia, providing the infrastructure backbone for the Eurasian partnership—from the Northern Sea Route and up to the Trans-Siberian Railway, Baikal–Amur Mainline, Trans-Asian Highway and cross-continental pipelines. The “post-Ukrainian” world seems to be moving toward a new, indivisible Eurasian security architecture, relying on existing institutions: the Union State, CSTO, EAEU, CIS, BRICS, SCO and ASEAN. Minsk has put forward an initiative to develop a Eurasian Charter for Diversity and Multipolarity—a strategic vision for a new system of international relations to replace the “rules-based” world order. An important event of 2024 in this context is the expansion of the BRICS club (see Figure 6). Its combined economic power could potentially reach $67 trillion, surpassing the total GDP of the G7 countries. Figure 6. Economic potential of BRICS countries Source: calculations by A.A. Dynkin, IMEMO RAS, based on the data from the IMF, Food and Agriculture Organization, World Steel Association, Energy Transition Institute, Statistical Review of World Energy 2023, International Energy Agency. And there are still 28 more countries on the “waiting list”. In several important markets such as metals, automotive industry, oil and mineral fertilizers, BRICS already matches or exceeds the potential of the G7 nations. Russia, which took over the BRICS rotating presidency in 2024, faces the task of energizing the harmonized economic and technological policies of the members. This approach is the institutional cornerstone of the future polycentric world. What will the coming world order look like? It is difficult to say which of the two trends—bipolarity or polycentrism—will prevail in the end. It is more likely that they will coexist: for example, rigid bipolarity in the Global North and polycentrism in the Global South. Signs of military, economic and technological bipolarity are already visible in the North. Interestingly, New Delhi tends to categorize China as a country of the North [Jaishankar 2020: 240]. This viewpoint has substance, as China is far ahead of other countries of the Global South in terms of GDP per capita ($12,541). For comparison, India’s GDP per capita is $2,612. [13] The decoupling of the U.S. and Chinese economies has not affected trade flows yet, but only technology and investment. In 2023, China saw a reversal of foreign direct investment inflows, with funds previously invested being withdrawn. Negative trends took hold, and the outflow approached negative $1.5 trillion (see Figure 7). Meanwhile, the Asia-Pacific macro-region is gaining greater internal dynamics, unlike Europe or North America. Figure 7. U.S.–China Economic Decoupling Source: UN Comtrade Database. https://comtradeplus.un.org/; State Administration of Foreign Exchange (SAFE) of the People’s Republic of China. https://www.safe.gov.cn/en/. Meanwhile, the trend toward political polycentricity persists. For example, New Delhi and Ankara were initially poles apart on the Palestinian–Israeli conflict. This is also the dawning of post-unipolarity, where the new centers of power are increasingly guided by their own interests in decision-making rather than by any “rules” or advice from Washington, Beijing or Moscow. It would be unrealistic to expect that the future world order will be free of conflict. The world will retain its diversity, with different potentials of countries and their competition. It is crucial that, despite their differences, the interests of larger and smaller nations are respected, and problems are solved through constructive dialogue. Russia was the first to challenge the notorious unipolar world order. Today we can state that most countries in the Global South have responded to this challenge and refused to subscribe to the Western interpretation of the conflict in Ukraine . The future world order is taking shape right before our eyes. I am sure that a multipolar world is preferable for Russia as a developed, self-sufficient and sovereign nation. But this world also requires a new system of global governance, development and strengthening of its institutions, such as BRICS, G20, SCO and EAEU. For instance, the EAEU member states (Russia, Belarus, Kazakhstan, Armenia, Kyrgyzstan) are faring much better than the five other post-Soviet countries. In 2022, GDP per capita in the countries of the Eurasian Economic Union was 3.5 times higher than the average for the fi e other CIS states that are not part of the EAEU (Azerbaijan, Moldova, Tajikistan, Turkmenistan, Uzbekistan) (see Figure 8). Our strategy in these organizations requires a solid approach and “stereoscopic” vision from socio-economic, scientific, technological and political perspectives. Here, the Russian Academy of Sciences should play a major role as a leader of scientific and expert community. Figure 8. Economic trends of EAEU and CIS countries Source: EEC. https://eec.eaeunion.org/?ysclid=lr7rtdg7np631919243; IMF. https://www.imf.org/; World Bank. https://www.worldbank.org/.  Conclusion In conclusion, there are compelling arguments both for multipolarity and for a new bipolarity. Leading U.S. experts are asking similar questions: “What order will replace the crumbling US-led system is far from certain. Will China push aside the United States as the global hegemon to lead a world according to rules written in Chinese characters? Will the world become bipolar, divided between two more or less rigidly defined blocs led by the United States and China? Will a genuinely multipolar world emerge based on several states or coalitions of more or less equal strength?” [Graham 2023: 272]. These questions are yet to be answered, and definitive conclusions in this case are premature. Given this high uncertainty, one should be prepared for any scenario. The essential prerequisite for such readiness is Russia’s strategic autonomy based on military-strategic parity with the U.S. The fundamental question to which the author has no answer today is: how likely is the emergence of a new world order without a major war? In 2024, presidential or parliamentary elections will take place (or have already taken place) in 50 countries, which account for more than 45% of the world’s GDP and population. Perhaps their results will clarify our vision of the near future. Dynkin A.A. (2024). World order transformation: economy, ideology, technology. Polis. Political Studies, 5, 8-23. https://doi.org/10.17976/jpps/2024.05.02 This article was prepared with the support of a grant from the Ministry of Science and Higher Education of the Russian Federation for major scientific projects in priority areas of scientific and technological development No. 075-15-2024-551 “Global and regional centers of power in the emerging world order”. The author expresses gratitude to his colleagues at IMEMO RAS R.I. Kapelyushnikov, V.D. Milovidov, I.S. Semenenko, I.V. Danilin, S.V. Zhukov, K.V. Bogdanov, A.P. Guchanova for consultations and assistance in preparing this article. References Büchs, M., & Koch, M. (2017). Critiques of growth. In M. Büchs, & M. Koch. Postgrowth and Wellbeing: Challenges to Sustainable Welfare (pp. 39-56). London: Palgrave Macmillan. https://doi.org/10.1007/978-3319-59903-8_4 Delgado, R.,& Stefancic, J. (2017). Critical race theory. Anintroduction. New York: New York University Press. Graham, T. (2023). Getting Russia right. UK: Polity Books. Huntington, S.P. (1993). The clash of civilizations? Foreign Affairs, 72(3), 22-49. https://www.foreignaffairs.com/articles/united-states/1993-06-01/clash-civilizations Jaishankar, S. (2020). The India way: strategies for an uncertain world. New Delhi; New York: Harper Collins Publishers India. Kupchan, C. (2021). Bipolarity is back: why it matters. The Washington Quarterly, 44(4), 123-139. https://doi.org/10.1080/0163660X.2021.2020457 Yan Xuetong. (2016). Political leadership and power redistribution. The Chinese Journal of International Politics, 9(1), 1-26. https://doi.org/10.1093/cjip/pow002 Dynkin, A.A. (2020). International turbulence and Russia. Herald of the Russian Academy of Sciences, 90(2), 127-137. https://doi.org/10.1134/S101933162002001X. Primakov, E.M. (1996). Mezhdunarodnye otnosheniya nakanune XXI veka: problemy, perspektivy [International Relations on the eve of 21st century: problems, prospects]. Mezhdunarodnaya zhizn’, 10, 3-13. (In Russ.) Semenenko, I.S. (2023). Razdelyonnye obshchestva [Divided societies]. In I.S. Semenenko (Ed.), Identichnost’: lichnost’, obshchestvo, politika. Novye kontury issledovatel’skogo polya [Identity: The Individual, Society, and Politics. New Outlines of the Research Field] (pp. 27-35). Moscow: Ves’ Mir. (In Russ.) https://www.imemo.ru/files/File/ru/publ/2023/Identichnost-Semenenko-2023.pdf Литература на русском языке Дынкин А.А. 2020. Международная турбулентность и Россия. Вестник РАН. Т. 90. № 3. С. 208-219. https://doi.org/10.31857/S0869587320030032. EDN: WINCQO. Примаков Е.М. 1996. Международные отношения накануне XXI в.: проблемы, перспективы. Международная жизнь. № 10. С. 3-13. Семененко И.С. 2023. Разделенные общества. Идентичность: личность, общество, политика. Новые контуры исследовательского поля. Отв. ред. И.С. Семененко. М.: Весь Мир. С. 27-35. https://www.imemo.ru/files/File/ru/publ/2023/Identichnost-Semenenko-2023.pdf. EDN: NTQYRB. 1. The world order or international system is a stable set of institutions and norms of military-political and economic relations, which is institutionalized and legitimate in the international legal sense. The world order remains stable during the active life of at least one generation—a universal measure of social time. However, in the wake of geopolitical macro-crises, illegitimate systems emerge, forcibly imposed by the winner. This was the case with the unipolar world order. 2. Dynkin A., Burrows M. Here’s the Playbook for Getting U.S.–Russian Cooperation Back on Track. The National Interest. 07.12.2015. https://nationalinterest.org/feature/heres-the-playbook-getting-us-russian-cooperation-back-track-14527. 3. For example, see: [Yan Xuetong 2016; Kupchan 2021]. 4. Remarks by the President in the State of the Union Address. The White House. President Barack Obama. 12.02.2013. https://obamawhitehouse.archives.gov/the-press-office/2013/02/12/remarks-president-state-union-address. 5. President Bush Calls on Senate to Back Human Cloning Ban. Remarks by the President on Human Cloning Legislation. The East Room. The White House. President George W. Bush. 10.04.2002. https://georgewbush-whitehouse.archives.gov/news/releases/2002/04/20020410-4.html. 6. Private sector establishments birth and death, seasonally adjusted. U.S. Bureau of Labor Statistics. 25.10.2023. https://www.bls.gov/news.release/cewbd.t08.htm. 7. Artificial Intelligence Journey 2023 conference. President of Russia. Official website. 24.11.2023. http://www.en.kremlin.ru/events/president/transcripts/72811. 8. World Population Prospects 2024, Online Edition. United Nations, Department of Economic and Social Affairs, Population Division (2024). https://population.un.org/wpp/Download/Standard/MostUsed/. 9. Global Health Expenditure database. World Health Organization. https://apps.who.int/nha/database. 10. Dirigisme is a policy of active state intervention in the national economy, pursued by France and the UK in mid-1940s. 11. Mendenhall A. Cultural Marxism is Real. The James G. Martin Center for Academic Renewal. 04.01.2019. https://www.jamesgmartin.center/2019/01/cultural-marxism-is-real/. 12. AFA Calls for an End to Required Diversity Statements. Press Release. AFA. Princeton, NJ. 22.08.2022. https://academicfreedom.org/afa-calls-for-an-end-to-required-diversity-statements/. 13. World Economic Outlook Database (October 2023 Edition). International Monetary Fund. 10.10.2023. https://www.imf.org/en/Publications/WEO/weo-database/2023/October.

Energy & Economics
Middle East Conflict. Conceptual photo

How might a wider Middle East conflict affect the global economy?

by Ahmet Kaya

한국어로 읽기 Leer en español In Deutsch lesen Gap اقرأ بالعربية Lire en français Читать на русском The world economy is underperforming as a result of tight monetary policies, weaker global trade, a slowing Chinese economy and uncertainty around the US election. An escalation of conflict in the Middle East could increase uncertainties, harming inflation reduction efforts and hurting growth. It has been over a year since the Hamas-led attack on Israel. Israel’s response in Gaza has resulted in widespread destruction and significant loss of life. The conflict has since expanded beyond Gaza, involving the Houthis in Yemen, Hezbollah in Lebanon and Iranian strikes targeting Israel. In addition to the awful humanitarian cost of the conflicts, the war and the possibility of its further expansion pose significant repercussions for the global economy. This article discusses three potential ways in which the current conflict and a wider conflict in the Middle East could affect the global economy. Increased geopolitical uncertainties First and foremost, an escalation of the Middle East conflict could lead to greater geopolitical uncertainties. Figure 1 shows the evolution of the geopolitical risk (GPR) and geopolitical acts (GPRA) indices (Caldara and Iacoviello, 2022) – these are text-based measures of heightened uncertainties due to adverse geopolitical events such as wars, terrorism and international tensions. (See this article for more discussion about these measures.) Following the Hamas-led attack on 7 October 2023, both the overall GPR index and its ‘war and terror acts’ component spiked strongly, to a level higher than that seen during the ISIS attack in Paris in November 2015. Both indices eased significantly in the months following October 2023 despite the continuation of the conflict. But they jumped again following Israel’s attack on southern Lebanon in September 2024. As of mid-October 2024, the GPR and GPRA remain, respectively, 21% and 35% higher than their historical averages.   What might be the consequences of such elevated levels of risk? Research tells us that higher geopolitical risk raises oil prices (Mignon and Saadaoui, 2024). It also reduces global investment and increases inflation (Caldara et al, 2022). Greater geopolitical risk has a significantly negative impact on business and consumer confidence in several advanced economies (de Wet, 2023). This is because consumers typically cut non-essential spending and businesses postpone investment decisions during turbulent times. This reduces firm-level investment, particularly for businesses with higher initial investment costs and greater market power (Wang et al, 2023). Higher geopolitical risks also reduce global trade and financial flows, causing greater volatility in capital flows in emerging markets (Kaya and Erden, 2023). Oil production cuts and higher energy prices The second way in which the Middle East conflict could affect the global economy is its impact on energy prices, both directly through production cuts and indirectly through greater uncertainties. In response to Israel’s actions against its neighbours, the Organization of the Petroleum Exporting Countries (OPEC) could reduce oil production to penalise countries supporting Israel. A similar action in the 1970s led to a significant jump in oil prices, which contributed to years of stagflation, with higher global inflation and recessions in major economies. Before Israel's attack on Lebanon at the end of September, oil prices had been declining due to falling demand, particularly from China. On the supply side, oil production had increased in Canada and the United States, countering the production cuts by OPEC, and Saudi Arabia was expected to increase oil production from December. But the situation quickly reversed following Israel’s attack on Lebanon. Oil prices jumped by nearly $10 per barrel within a week, before easing by around $5 per barrel. While the immediate oil price impact of Israel’s attack has mostly faded, the potential for higher oil (and other energy) prices still poses a risk to global inflation and economic activity (Liadze et al, 2022). To provide further context for the potential scale of this impact, we can show what would happen if oil and gas prices were to remain $10 higher for two years than the baseline levels projected in the Summer Global Economic Outlook from the National Institute of Economic and Social Research (NIESR), using NIESR’s Global Macroeconometric Model (NiGEM). The results demonstrate that the $10 rise in oil and gas prices increases inflation by around 0.7 percentage points in major economies in the first year (see Figure 2). The impact is higher in China, where the economy relies relatively more on oil imports for its strong manufacturing industries. The inflationary pressures persist for two years despite central banks’ efforts to curb inflation by increasing interest rates.   The effect of higher oil and gas prices on real GDP is shown in Figure 3. In the scenario described above, GDP would fall by 0.1-0.2% in major economies immediately. Partly due to higher interest rates, real GDP would continue to weaken for three years following the shock. After this, economic activity would start to return to base levels as oil and gas prices revert to their levels in the baseline forecast.   Increased shipping costs and supply chain disruptions A wider conflict in the Middle East could also affect the economy through higher shipping costs and supply chain disruptions. Houthi attacks on commercial ships in the Red Sea in late 2023 showed that such disruptions can have a huge impact on global trade through shipping, which comprises 80% of world trade volume. Following the rocket attacks by the Houthi rebels, some commercial shipping re-routed from the Red Sea to the Cape of Good Hope, leading to significant delays in travel times and increased freight costs. As a result, the Shanghai Containerized Freight Index – a measure of sea freight rates – rose by around 260% in the second quarter of 2024 with additional disruptions to supply chains. Our analysis shows that an increase of 10 percentage points in shipping cost inflation can lead to import prices rising by up to around 1% and consumer inflation increasing by around 0.5% in OECD countries. As Figure 4 shows, the impact of shipping costs on inflation shows its full effects over six quarters. This means that inflationary concerns could be with us for the next year and a half as a result of higher shipping costs that may emerge from any possible escalation of the Middle East conflict.   Wider economic implications and policy responses While rising geopolitical risk and increased oil and shipping costs can each individually exert upward pressure on inflation and may slow down economic activity in the global economy, the combined impacts are likely to be greater. Countries with stronger trade and financial ties to the Middle East and those that rely heavily on oil imports as an input for domestic production would be most affected. On the monetary policy front, central banks may have to take a more hawkish stance in response to rising inflationary pressures from the Middle East conflict. This could lead to higher interest rates, which would further dampen economic activity, particularly in an environment where there are already recessionary concerns in some major economies. Beyond its immediate economic implications, an escalation of the Middle East conflict could trigger large-scale displacement of people, which would increase economic and social pressures on neighbouring countries. Many countries may also have to increase their military spending in response to growing regional tensions. Given that public debt levels are already elevated in many countries due to successive shocks to the global economy over the past decade, any additional defence spending could come at the expense of public infrastructure investments that would otherwise boost productivity growth. Overall, the global economy is already underperforming as a result of the lagged effects of tight monetary policies, weaker global trade, a slowing Chinese economy and uncertainties surrounding the upcoming US election and possible changes to US trade policy. A potential escalation of conflict in the Middle East could exacerbate the situation by increasing uncertainties, harming efforts to bring down inflation and reducing global GDP growth. Over the medium and long term, it could further damage the global economy, with the possibility of refugee crises as well as increased defence spending, making the effects more complex and longer lasting. This work is licensed under a Creative Commons Attribution-ShareAlike 4.0 International License.

Energy & Economics
Press Conference by European Commission President Ursula von der LEYEN and Mario DRAGHI on the Report on the Future of EU Competitiveness in Brussels, Belgium on September 9, 2024.

Press statement by President von der Leyen on the occasion of the Mercosur leaders' meeting

by Ursula von der Leyen

Leer en español In Deutsch lesen Gap اقرأ بالعربية Lire en français Читать на русском Ladies and Gentlemen, Today marks a truly historic milestone. Let me begin by thanking the Chief Negotiators for their dedication and determination. They worked tirelessly, over many years, for an ambitious and balanced agreement – and they succeeded. The bond between Europe and the Mercosur countries is truly one of the strongest in the world. It is a bond anchored in trust, enriched by a shared heritage, that spans centuries of mutual learning and growth. In fact, exactly 30 years ago, in 1994, my predecessor Jacques Delors stood here in Montevideo. He met with your father, dear Luis, who was then President of Uruguay. Together they shared a bold vision. A vision of deeper integration, not only within Europe and Mercosur, but also between them. Today, in Montevideo, we are turning that vision into reality. We are strengthening this unique partnership as never before. And in doing so, we are sending a clear and powerful message to the world. First, in an increasingly confrontational world, we demonstrate that democracies can rely on each other. This agreement is not just an economic opportunity, it is a political necessity. We are like-minded partners. We both believe that openness and cooperation are the true engines of progress and prosperity. I know that strong winds are blowing in the opposite direction – towards isolation and fragmentation. But this agreement is our clear response. We stand together on the global stage, as partners. Second, we are sending a message to our people and businesses in our regions: This agreement was designed with your interests at heart. It is made to work for you. It means: more jobs – and good jobs – more choices and better prices. The European Union and Mercosur create one of the largest trade and investment partnerships the world has ever seen. We are taking barriers down and we are allowing investments in. We are forming a market of over 700 million consumers. This partnership will strengthen entire value chains; it will develop strategic industries; it will support innovation; and it will create jobs and values, on both sides of the Atlantic. Third, we are showing the world that trade can – and must – be guided by values. Trade agreements are more than economic frameworks. They are a way to build communities of shared values. The EU-Mercosur agreement reflects our steadfast commitment to the Paris Agreement and to the fight against deforestation. President Lula's efforts to protect the Amazon are welcome and necessary. But preserving the Amazon is a shared responsibility of all humanity. This agreement ensures that investments respect Mercosur's extraordinary yet fragile natural heritage. My fourth message is that, economically, this is a win-win agreement. Europe is already a leading investment and trade partner for Mercosur. So you know how we do business together. We are focused on fairness and mutual respect. EU-Mercosur will bring meaningful benefits to consumers and businesses, on both sides. It will facilitate European investments in strategic industries across all Mercosur countries: like sustainable mining, renewable energy and sustainable forest products, just to name a few. It will also make it easier to invest in sectors that directly impact the people's daily lives. For example, expanding the electricity grid to rural and remote areas and advancing digitalisation across the region. Finally, let me address my fellow Europeans: This agreement is a win for Europe. 60,000 companies are exporting to Mercosur today – 30,000 of them are small and medium-sized enterprises. They benefit from reduced tariffs, simpler customs procedures and preferential access to some critical raw materials. This will create huge business opportunities. To our farmers: We have heard you, listened to your concerns and we are acting on them. This agreement includes robust safeguards to protect your livelihoods. EU-Mercosur is the biggest agreement ever, when it comes to the protection of EU food and drinks products. The agreement protects 350 EU geographical indications. In addition, our European health and food standards remain untouchable. This is the reality – the reality of an agreement that will save EU companies EUR 4 billion worth of export duties per year while expanding our markets and opening new opportunities for growth and jobs on both sides. I want to thank President Lacalle Pou for hosting this Summit and for bringing us together in Montevideo. This is a good day for Mercosur, a good day for Europe and a landmark moment for our shared future. A whole generation dedicated their effort, vision and determination to bring this agreement to life. Now, it is our turn to honour that legacy. Let us ensure that this agreement delivers on its promises and serves the generations to come. Thank you very much.

Energy & Economics
Trump - Putin - Flags

The World Awaits Change

by Andrei Kortunov

Leer en español In Deutsch lesen Gap اقرأ بالعربية Lire en français Читать на русском “Changes! We’re waiting for changes!” proclaimed Viktor Tsoi nearly 40 years ago, at the dawn of the Soviet perestroika. If one were to summarize the multitude of diverse and contradictory events, trends, and sentiments of the past year in a single phrase, it would be that the modern world is eagerly awaiting change. Much like the former USSR in the 1980s, few today can clearly define what these changes should entail or what their ultimate outcome will be. Yet, the idea of maintaining the status quo has evidently found little favor with the public over the past year. This impatient anticipation of change was reflected, for instance, in the outcomes of numerous elections held over the past 12 months across the globe. In total, more than 1.6 billion people went to the polls, and in most cases, supporters of the status quo lost ground. In the United States, the Democrats suffered a resounding defeat to the Republicans, while in the United Kingdom, the Conservatives were decisively beaten by the Labour Party. In France, Emmanuel Macron's once-dominant ruling party found itself squeezed between right-wing and left-wing opposition, plunging the Fifth Republic into a deep political crisis. The seemingly stable foundations of political centrism were shaken in Germany, South Korea, and Japan. Even the party of the highly popular Indian Prime Minister Narendra Modi failed to retain its parliamentary majority after the elections, and in South Africa, the African National Congress led by Cyril Ramaphosa also lost its majority. Pessimists might argue that abandoning the status quo in itself solves no problems, and the much-anticipated changes, as the final years of the Soviet Union demonstrated, do not necessarily lead to positive outcomes. Replacing cautious technocrats with reckless populists often backfires, affecting those most critical of the entrenched status quo. Optimists, on the other hand, would counter that the rusted structures of state machinery everywhere are in desperate need of radical modernization. They would add that the costs inevitably associated with maintaining the existing state of affairs at all costs far outweigh any risks tied to attempts to change it. The international events of the past year are also open to various interpretations. Pessimists would undoubtedly point out that none of the major armed conflicts carried over from 2023 were resolved in 2024. On the contrary, many of them showed clear tendencies toward escalation. For instance, in late summer, Ukraine launched an incursion into the Kursk region of Russia, and in mid-November, the U.S. authorized Kyiv to use long-range ATACMS missiles against targets deep within Russian territory. Meanwhile, the military operation launched by Israel in Gaza in the fall of 2023 gradually expanded to the West Bank, then to southern Lebanon, and by the end of 2024, to parts of Syrian territory adjacent to the Golan Heights. From the optimists' perspective, however, the past year demonstrated that the disintegration of the old international system has its limits. A direct military confrontation between Russia and NATO did not occur, nor did a large-scale regional war break out in the Middle East, the Taiwan Strait, or the Korean Peninsula. The economic results of 2024 are equally ambiguous. On one hand, the global economy remained heavily influenced by geopolitics throughout the year. The process of “technological decoupling” between the U.S. and China continued, and unilateral sanctions firmly established themselves as a key instrument of Western foreign policy. On the other hand, the world managed to avoid a deep economic recession despite the numerous trade and investment restrictions. Global economic growth for the year is expected to reach around 3%, which is quite respectable for such turbulent times, especially considering that the long-term effects of the COVID-19 pandemic have not yet been fully overcome. In 2024, the average annual global temperature exceeded pre-industrial levels by more than 1,5 °C for the first time, crossing another critical “red line”. However, the UN Climate Change Conference (COP29) held in November in Baku fell short of many expectations. At the same time, China reached its peak carbon emissions by the end of the year, achieving this milestone a full five years ahead of previously announced plans. In the past year, the UN Security Council managed to adopt only 12 resolutions, mostly of a humanitarian nature, clearly reflecting the declining effectiveness of this global governance body. For comparison, in 2000, the Security Council approved 29 resolutions, including key decisions on conflict resolution in the Balkans and Africa. At the same time, 2024 saw continued efforts to explore new formats for multilateral cooperation, including mechanisms within the BRICS group, which held its 16th summit in Kazan for the first time in its newly expanded composition. With enough imagination, one can easily find evidence in the past 12 months to confirm any omen or superstition traditionally associated with leap years. However, all these signs and superstitions predicting upheavals and catastrophes—while aligning with the pessimistic conclusions about the year now ending—do not apply to the year ahead. Human nature, after all, tends to lean more towards optimism than pessimism; if it were the other way around, we would still be living in caves. As they bid farewell to a difficult and challenging year, people around the world continue to hope for better times. And the mere act of hoping for the best is already significant in itself. As Johann Wolfgang von Goethe aptly remarked, “Our wishes are forebodings of our capabilities, harbingers of what we are destined to achieve”. Originally published in Izvestia.

Energy & Economics
US - 11.14.2024:

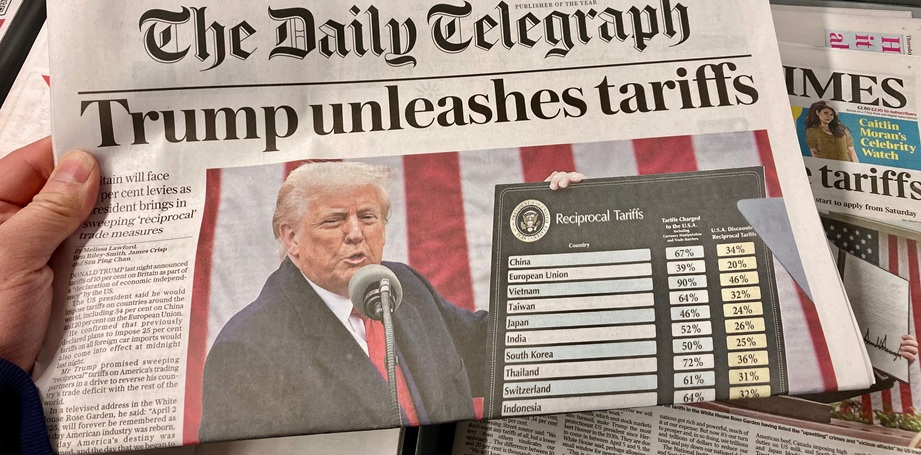
The Economic Impacts of Trump Administration's Tariffs

by World & New World Journal Policy Team

한국어로 읽기 Leer en español In Deutsch lesen Gap اقرأ بالعربية Lire en français Читать на русском I. Introduction  We are only two and a half months into the new Trump administration. However, President Donald Trump's long-threatened tariffs have plunged the country into a trade war abroad. On-again, off-again, new tariffs continue to escalate uncertainty around the world. Trump already launched a trade war during his first term in office, but he has more sweeping tariff plans right now. The second Trump administration has embarked on a new and more aggressive tariff policy, citing various economic and national security concerns. His administration has proposed, imposed, suspended, revoked, and then reimposed various new tariffs. It could be difficult for average citizens to keep up with all the proposals. As of March 19, 2025, there are ten proposed or active tariff initiatives. They range from broad-based tariffs that cover all goods from a certain country (China, Mexico, Canada) to tariffs that cover certain types of goods (aluminum & steel), promises of future tariffs (copper, lumber, automotive, semiconductor, and pharmaceutical), and promised retaliatory tariffs (European wine and other alcoholic beverages). Moreover, although we have seen more tariff announcements in the first two months of the second Trump administration than in the entire first Trump administration, "fair and reciprocal" tariff rollout will overpower the tariffs imposed until today. The ten tariff initiatives that are proposed or in play are as follows in Table 1.   This paper aims to evaluate economic impacts of tariffs imposed by the Trump administration. It first explains the effects of tariffs imposed by the first Trump administration and then forecasts the impacts of the second Trump administration's tariffs.  II. Literature on Tariff Effects A tariff is a type of tax that a government adds to imported goods. Companies importing goods pay the tariff to the government. If any part of a product arrives with a tariff, whether it is an imported avocado or a car built locally with imported steel, its cost is part of the price everyday consumers pay before sales tax.  Economists reject tariffs as an effective tool to improve the welfare of U.S. citizens or strengthen key industries. In a survey conducted during the first Trump administration, 93 % of economic experts did not agree that targeted tariffs on aluminium and steel would improve Americans' welfare. Recent research has strengthened economists' opposition to this policy instrument. Numerous studies demonstrate that American consumers entirely bear the burden of tariffs imposed during the first Trump administration, with disproportionately large impacts on lower-income U.S. households. A framework for analysing the impact of higher import tariffs on the economy is provided by Mundell and Fleming. Mundell (1961) claimed that the country that raised tariffs on imported products may benefit because more people choose domestically produced products over imported ones. Protection from foreign competition could also benefit domestic industries. Large countries can also benefit from improved terms of trade. However, increased tariffs on imported products are assumed to lead to an increase in the current account balance by increasing savings relative to investment. Higher savings dampen aggregate demand. The situation of households deteriorates because of rising consumer prices. Domestic industries are also negatively affected by lower household demand and the need to pay more for imported input products.  Over the years, Mundell and Fleming's model has been developed further by other scholars such as Eichengreen (1981), Krugman (1982), Obstfeld and Rogoff (1995) and Eichengreen (2018). Overall, the theoretical literature demonstrates that higher import tariffs could affect the economy through various channels. The impacts of tariffs on the economy differ between a nation imposing the tariffs and nations exporting to the nation raising the tariffs. However, nations that are not subject to the increased import duties are also affected. Main effects of higher tariffs are as follows: Higher inflation: Higher import tariffs lead to higher prices for imported products. Depending on which tariffs are increased, this could lead to higher prices for both consumers and companies. Domestic firms may also raise their prices because of reduced competition from foreign companies (Cavallo et al. (2021)).  Higher consumer prices lead to a decline in real disposable household income, which hampers private consumption. Higher business costs have impacts on companies' profits, which in turn dampen employment and companies' willingness to invest. Companies are also more likely to pass on some of their higher costs to consumers in the form of higher prices. The rise in imported prices might be smaller in large countries, as they are more able to influence the world price of products. Increased consumption of other products: Higher imported prices can lead companies and consumers to increasingly buy cheaper domestic products. But it can also lead to increased imports of products from countries not subject to higher import tariffs.  Domestic industries are protected: Higher import tariffs improve the competitive position of domestic companies. These benefits can lead to increased investment, production, and employment in protected industries. However, the longer-term effect of protecting some domestic industries from foreign competition can be negative, as it might reduce incentives to improve production efficiency, thereby dampening productivity and GDP.  Decreased trade: Increased tariffs usually lead to reduced trade. This can lead to reduced knowledge transfer between nations in the form of less direct investment, reduced technology transfer, and reduced access to skilled labour. These factors in turn can lead to companies moving further away from the technological frontier, thereby hampering productivity (Dornbusch (1992) and Frankel and Romer (1999)).  Stronger exchange rate: When demand changes from foreign to domestic production, the exchange rate tends to rise to balance it out. One reason is that higher inflation often leads to higher interest rates relative to other nations. The nominal exchange rate might appreciate if imports decline significantly and demand for foreign currency drops. An appreciation of the exchange rate hampers exports but keeps imports cheaper.  Global value chains: Higher tariffs can lead to disruptions in global value chains by making imported inputs from abroad pricier. If firms are part of global value chains, higher costs for firms facing higher import costs may also lead to higher costs for domestic firms further down the production chain.  Uncertainty and confidence: Higher import tariffs may increase uncertainty about future trade policy and lead to increased pessimism among households and companies. Such uncertainty may hamper household consumption and business investment (Boer and Rieth (2024)).  III. Tariffs under the first Trump administration The first Trump administration's tariffs involved protectionist trade initiatives against other nations, notably China.  In January 2018, the Trump administration-imposed tariffs on solar panels and washing machines of 30–50%. In March 2018, the administration-imposed tariffs on aluminium (10%) and steel (25%), which are imported from most countries. In June 2018, the Administration expanded these tariffs to include the EU, Mexico, and Canada. The Trump administration separately set and escalated tariffs on products imported from China, leading to a trade war between the U.S. and China.  In their responses, U.S. trading partners imposed retaliatory tariffs on U.S. products. Canada imposed matching retaliatory tariffs on July 1, 2018. China implemented retaliatory tariffs equivalent to the $34 billion tariff imposed on it by the U.S. In June 2019, India imposed retaliatory tariffs on $240 million worth of U.S. products.  However, tariff negotiations in North America were under way and successful, with the U.S. lifting steel and aluminium tariffs on Mexico and Canada on May 20, 2019. Mexico and Canada joined Argentina and Australia, which were the only countries exempted from the tariffs. But on May 30, Trump announced on his own that he would put a 5% tariff on all imports from Mexico starting on June 10, 2019. The tariffs would go up to 10% on July 1, and then by another 5% every month for three months, until illegal immigrants stopped coming through Mexico and into the U.S. Then the tariffs were averted on June 7 after negotiations between the U.S. and Mexico. U.S. tariffs on Chinese products had been applied as follows: On March 22, 2018, Trump signed a memorandum under Section 301 of the Trade Act of 1974 to apply tariffs of $50 billion on Chinese products. In response, China announced plans to implement its tariffs on 128 U.S. products. 120 of those products, such as fruit and wine, will be taxed at a 15% duty, while the remaining eight products, including pork, will receive a 25% tariff. China implemented their tariffs on April 2, 2018.  On April 3, 2018, the U.S. Trade Representative's office (the USTR) published an initial list of 1,300+ Chinese products to impose levies upon products like flat-screen televisions, medical devices, aircraft parts and batteries. On April 4, 2018, China's Customs Tariff Commission of the State Council decided to announce a plan to put 25% more tariffs on 106 U.S. goods, such as soybeans and cars.  In the response, On April 5, 2018, President Trump directed the USTR to consider $100 billion in additional tariffs. On May 9, 2018, China cancelled soybean orders exported from the United States to China. On June 15, 2018, President Trump released a list of Chinese products worth $34 billion that would face a 25% tariff, starting on July 6. Another list with $16 billion of Chinese products was released, with an implementation date of August 23.  On July 10, 2018, in reaction to China's retaliatory tariffs that took effect July 6, the USTR issued a proposed list of Chinese products amounting to an annual trade value of about $200 billion that would be subjected to an additional 10% in duties. During the G20 summit in Japan in June 2019, the U.S. and China agreed to resume stalled trade talks, with Trump announcing he would suspend an additional $300 billion in tariffs that had been under consideration. IV. Economic Effects of the Tariffs from the First Trump Administration Changes in tariffs affect economic activity directly by influencing the price of imported products and indirectly through changes in exchange rates and real incomes. The extent of the price change and its impact on trade flows, employment, and production in the United States and abroad depend on resource constraints and how various economic actors (producers of domestic substitutes, foreign producers of the goods subject to the tariffs, producers in downstream industries, and consumers) respond as the effects of the increased tariffs reverberate throughout the economy. According to the U.S. Congressional Research Service (CRS), the following six outcomes came out at the level of individual firms and consumers as well as at the level of the national economy. 1. Increased costs for U.S. consumers Higher tariff rates lead to price increases for consumers of products subject to the tariffs and for consumers of downstream products as input costs rise. Higher prices in turn lead to decreased consumption, depending on consumers' price sensitivity for a particular product. For example, consider the monthly price of U.S. laundry equipment, which includes washing machines subject to tariff increases as high as 50% since February 2018. The monthly price of this equipment increased by as much as 14% in 2018 compared to the average price level in 2017, before the tariffs took effect (see Figure 1).   Figure 1: U.S. laundry equipment prices According to Jin (2023), many companies passed the costs of the Trump tariffs on to consumers in the form of higher prices. Following impositions of the tariffs on Chinese products, the prices of U.S. intermediate goods rose by 10% to 30%, an amount equivalent to the size of the tariffs. An April 2019 working paper by Flaaen, Hortaçsu, and Tintel not found that the tariffs on washing machines caused the prices of washers to rise by approximately 12% in the United States. A Goldman Sachs analysis by Fitzgerald in May 2019 found that the consumer price index (CPI) for tariffed products had increased dramatically, compared to a declining CPI for all other core goods. According to the Guardian, the Budget Lab at Yale University found that American consumer prices could rise by 1.4% to 5.1% if Trump implemented his comprehensive tariff plan, which would amount to an additional $1,900 to $7,600 per household. 2. Decreased domestic demand for imported goods subject to the tariffs and less competition for U.S. producers of substitute goods: U.S. producers competing with the imported products subject to the tariffs (e.g., domestic aluminium and steel producers) may benefit to the degree they are able to charge higher prices for their domestic products and may expand production because of increased profitability. Since March 2018, U.S. imports of steel and aluminium have faced additional tariff charges of 25% and 10%, making foreign supplies of these products more expensive relative to domestic products. Because of these tariffs, U.S. imports of these goods went down in 2018 and 2019 compared to what they were usually like in 2017 before the tariffs, while U.S. production went up (see Figure 2 and Figure 3). By the first quarter of 2020, real U.S. imports of steel and aluminium (adjusted for price fluctuations) had decreased by more than 30% and 16%, respectively, from their average 2017 levels. The quarterly production of steel and aluminium in the U.S. during this period, however, increased by as much as 13.5% and 9.0%, respectively, above average 2017 levels.   Figure 2: Domestic production and imports: Steel  Figure 3: Domestic production and imports: Aluminium 3. Increased costs for U.S. producers in downstream industries, resulting in a decline in employment U.S. producers that use imported products subject to the additional tariffs as inputs ("downstream" industries, such as auto manufacturers in the case of the aluminium and steel tariffs) might be harmed as their costs of production increase. Higher input costs are more likely to lead to some combination of lower profits for producers, which in turn might dampen demand for these downstream products, leading to some contraction in these sectors.  A study (2019) by Federal Reserve Board economists Flaaen and Pierce, which examined effects on the manufacturing sector from all U.S. tariff actions in 2018, found that higher input costs from the tariffs were associated with higher prices, employment declines, and reductions in output for affected firms. Another study (2020) by Handley, Kamal, and Monarch found that the higher input costs associated with the tariffs might have led to a decrease in U.S. exports for firms reliant on imported intermediate inputs. Handley, Kamal, and Monarch suggested that export growth was approximately 2% lower for products made with products subject to higher U.S. tariffs, relative to unaffected products. Another study (2019) by Federal Reserve Board economists Flaaen and Pierce found that the steel tariffs led to 0.6% fewer jobs in the manufacturing sector than would have happened in the absence of the tariffs; this cut amounted to approximately 75,000 jobs. A study (2024) by Ma and David concluded that the United States lost 245,000 jobs because of the Trump tariffs.  4. Decreased demand for U.S. exports subject to retaliatory tariffs  Retaliatory tariffs place U.S. exporters at a price disadvantage in export markets relative to competitors from other countries, potentially decreasing demand for U.S. exports to those markets. Since Q3 2018, after Section 232 retaliatory tariffs took effect in China, the EU, Russia, and Türkiye, U.S. exports to these trading partners subject to the tariffs declined by as much as 44% below their 2017 average values (Figure 4). U.S. exports to China subject to retaliation during the same period declined even further from their 2017 levels, falling as much as 68% on a quarterly basis. By contrast, during this same period, overall U.S. exports were as much as 10% higher each quarter relative to 2017, suggesting the retaliatory tariffs played a role in the product-specific export declines.  Figure 4: Declines in U.S. exports subject to retaliation A study by Fajgelbaum, Goldberg, Kennedy, and Khandelwal published in the Quarterly Journal of Economics in October 2019 estimated that consumers and firms in the U.S. who buy imports lost $51 billion (0.27% of GDP) because of the 2018 tariffs. This study also found that retaliatory tariffs resulted in a 9.9% decline in U.S. exports. This study also found that workers in counties with a lot of Republicans were hurt the most by the trade war because agricultural products were hit the hardest by retaliatory tariffs.  5. U.S. National Economy In addition to industry- or consumer-level effects, tariffs also have the potential to affect the broader U.S. national economy. Quantitative estimates of the effects vary based on modelling assumptions and techniques, but most studies suggest a negative overall impact on U.S. GDP because of the tariffs.  The Congressional Budget Office (2020) estimated that the increased tariffs in effect as of December 2019 would reduce U.S. GDP by 0.5% in 2020, below a baseline without the tariffs, while raising consumer prices by 0.5%, thereby reducing average real household income by $1,277. From a global perspective, the International Monetary Fund estimated that the tariffs would reduce global GDP in 2020 by 0.8%. Dario Caldara et al. (2020) also found that in 2018, investment dropped by 1.5% because of the uncertainty caused by U.S. trade policy. Moreover, a study (2019) by Amiti, Redding, and David published in the Journal of Economic Perspectives found that by December 2018, Trump's tariffs resulted in a reduction in aggregate U.S. real income of $1.4 billion per month in deadweight losses and cost U.S. consumers an additional $3.2 billion per month in added tax. Furthermore, Russ (2019) found that tariffs, which Trump imposed through mid-2019, combined with the policy uncertainty they created, would reduce the 2020 real GDP growth rate by one percentage point.  6. Trade balance  The Trump administration repeatedly raised concerns over the size of the U.S. trade deficit, thereby making trade deficit reduction a stated objective in negotiations for new U.S. trade agreements. Broad-based tariff increases affecting a large share of imports may reduce imports initially, but they are unlikely to reduce the overall trade deficit over the longer period due to at least two indirect impacts that counteract the initial reduction in imports. One indirect effect is a potential change in the value of the U.S. dollar relative to foreign currencies. Another potential effect of U.S. import tariffs is retaliatory tariffs. Economists argue that while tariffs placed on imports from a limited number of trading partners may reduce the bilateral U.S. trade deficit with those specific nations, this is likely to be offset by an increase in the trade deficit or reduction in the trade surplus with other nations, leaving the total U.S. trade deficit largely unchanged.  Figure 5 shows the relative change in the U.S. goods trade deficit with the world as well as the bilateral U.S. deficits with three major partners, China, Mexico, and Vietnam, from 2017 to 2019. Since the U.S. tariffs took effect, the overall U.S. trade deficit has increased, rising 8% from 2017 to 2019. However, the U.S. trade deficit in goods with China declined by 8% from 2017 to 2019, while the U.S. trade deficit in goods with Vietnam and Mexico significantly increased by more than 40% during the same period.  Figure 5: Changes in the U.S. goods trade deficits with China, Mexico, and Vietnam According to Zarroli (2019), between the time Trump took office in 2017 and March 2019, the U.S. trade deficit increased by $119 billion, reaching $621 billion, the highest it had been since 2008. American Farm Bureau Federation data showed that agriculture exports from the U.S. to China decreased from $19.5 billion in 2017 to $9.1 billion in 2018, a 53% reduction.  V. What are the Potential Consequences of Trump's Tariff Plan? Last year, the Peterson Institute for International Economics examined the impact of President Trump's proposed tariffs based on his campaign promises, which would impose 10 % additional tariffs on US imports from all sources and 60 % additional tariffs on imports from China. The major outcomes were lower national income, lower employment, and higher inflation. McKibbin, Hogan, and Noland (2024) at the Peterson Institute for International Economics found that both of Trump's tariff plans—imposing 10% additional tariffs on U.S. imports from all sources and 60% additional tariffs on imports from China—would reduce both U.S. real GDP and employment by 2028. But the former proposal damages the U.S. economy more than the latter. If other nations retaliate with higher tariffs on their imports from the U.S., the damage intensifies.  Assuming other governments respond in kind, Trump's 10 % increase results in U.S. real GDP that is 0.9 % lower than otherwise by 2026, and U.S. inflation rises 1.3 % above the baseline in 2025.  The 10 % added tariffs hurt the economies of Canada, Mexico, China, Germany, and Japan—all major US trading partners that see a lower GDP relative to their baselines through 2040. Mexico and Canada take much larger GDP hits than the U.S. The 60 % added tariffs on imports from China reduce its GDP relative to its baseline, much more than that of other U.S. trading partners. Mexico, however, sees a higher GDP than otherwise as some production shifts to Mexico from China. This paper focuses on Trump's universal 10 % tariffs rather than 60 % tariffs on imports from China because extreme 60 % tariffs on Chinese imports are not expected. McKibbin, Hogan, and Noland (2024) assume the 10 % tariff increase is implemented in 2025 and remains in place through the forecast period. They also consider a second scenario in which U.S. trading partners retaliate with equivalent tariff increases on products they import from the U.S.  Figures 6–11 show the results for the uniform additional 10 % increase in the tariff on imports of goods and services from all trading partners.   Figure 6: Projected change in real GDP of selected economies from an additional 10 % increase in US tariffs on imports of goods and services from all trading partners, 2025-40 (Source: McKibbin, Hogan, and Noland, 2024) When tariffs go up by 10%, the U.S. real GDP goes down by 0.36 % by 2026, and it goes down even more in Mexico and Canada by 2027 (see Figure 6). Chinese GDP drops by 0.25 % below the baseline in 2025. After the initial demand-induced slowdown, U.S. GDP recovers as production shifts from foreign suppliers to U.S. suppliers, leading to a slightly lower long-term GDP of 0.1 % below baseline by 2030 in the U.S.   Figure 7: Projected change in employment (hours worked) in selected economies from an additional 10 % increase in US tariffs on imports of goods and services from all trading partners, 2025-40 (Source: McKibbin, Hogan, and Noland, 2024) The results for aggregate employment are like the GDP outcomes (see figure 7). Employment drops in the United States by 0.6 % by 2026 but recovers due to a supply relocation towards U.S. suppliers. U.S. employment returns to baseline eventually because real wages decline permanently to bring employment back to baseline by assumption.  Figure 8: Projected change in inflation in selected economies from an additional 10% increase in US tariffs on imports of goods and services from all trading partners, 2025-40 (Source: McKibbin, Hogan, and Noland, 2024) The imposition of higher tariffs increases prices of both consumer and intermediate goods, contributing to a rise in inflation of 0.6 % above baseline in 2025 (see figure 8).  The higher tariff is inflationary everywhere except in China due to the tightening of Chinese monetary policy to resist change in the exchange rate relative to the U.S. dollar.   Figure 9: Projected change in the trade balance in selected economies from an additional 10 % increase in US tariffs on imports of goods and services from all trading partners, 2025-40 (Source: McKibbin, Hogan, and Noland (2024)) Figure 9 shows the change in the trade balance as a share of GDP. In theory, the trade balance can worsen or improve due to changes in exports and imports. From 2025 to 2028, the U.S. trade deficit narrows slightly but then widens as capital flows into the U.S. economy, appreciating the U.S. real effective exchange rate. By 2030, the U.S. trade deficit will worsen by 0.1 % of GDP due to capital moving from Mexico and Canada into the U.S. Government savings rise due to additional tariff revenues.  VI. Conclusion  This paper showed that tariffs imposed by the first Trump administration had negative impacts on the U.S. economy, particularly inflation, incomes, and employment. It also demonstrated that tariffs which will be imposed by the second Trump administration are expected to have negative effects on the U.S. economy. Then a question arises: "Why does Trump attempt to impose tariffs on products from abroad?" Today, more people mention tariffs as tools to protect U.S. companies and farmers. They are discussed as a tool for bringing back manufacturing businesses into the U.S. as well as a bargaining tactic in negotiations over the flow of fentanyl and immigration. Trump has used and promised to increase tariffs for three purposes: to raise revenue, to bring trade into balance, and to bring rival countries to heel. It is unclear whether Trump will achieve his goals. However, President Donald Trump believes that tariffs are a panacea. Trump believes that his tariffs would bring hundreds of billions—trillions— into the US Treasury. Moreover, Trump is confident that he can force countries to give up something he believes is in America's best interest. For example, his tariffs on Canada and Mexico have led Mexico and Canada to agree to expand their border patrols. Reference  Amiti Mary, Redding Stephen, David E, “The Impact of the 2018 Tariffs on Prices and Welfare,” Journal of Economic Perspectives. 33 (Fall 2019): 187–210. Boer, L. and M. Rieth, “The Macroeconomic Consequences of Import Tariffs and Trade Policy Uncertainty,” IMF Working Paper 2024/013, International Monetary Fund. Cavallo, A., G. Gopinath, B. Neiman, and J. Tang (2021), “Tariff Pass-Through at the Border and at the Store: Evidence from US Trade Policy,” American Economic Review: Insights 3(1): 19-34.  Congressional Budget Office, The Budget and Economic Outlook: 2020 to 2030, January 28, 2020. https://www.cbo.gov/system/files/2020-01/56020-CBO-Outlook.pdf.  Dario Caldara et al., “The Economic Effects of Trade Policy Uncertainty,” Journal of Monetary Economics, vol. 109 (January 2020), pp. 38-59. Dornbusch, R. (1992), “The Case for Trade Liberalization in Developing Countries,” Journal of Economic perspectives 6 (1): 69-85.  De Loecker, J., P.K. Goldberg, A.K. Khandelwal and N. Pavcnik (2016), “prices, markups, and trade reform,” Econometrica 84(2): 445-510.  Eichengreen, B. (1981), “A Dynamic Model of Tariffs and Employment under Flexible Exchange Rates,” Journal of International Economics 11:341-359.  Eichengreen, B. (2018), “Trade Policy and the Macroeconomy,” Keynote address Mun dell-Fleming Lecture, International Monetary Fund, 13 March 2018.  Fajgelbaum, P.D., P.K. Goldberg, P.J. Kennedy and A.K. Khandelwal (2019), “The Return to Protectionism,” The Quarterly Journal of Economics 135(1): 1-55.  Fitzgerald, Maggie, “This Chart from the Goldman Sachs Shows Tariffs are Rasing Prices for Consumers and It could Get Worse.” CNBC. May 13, 2019. Flaaen, A. and J.R. Pierce (2019), “Disentangling the effects of the 2018-2019 tariffs on globally connected U.S. Manufacturing sector,” Working Paper, Finance Economic Discussion Series 2019-086, Board of Governors Federal Reserve System, Washington DC.  Flaaen, A., A. Hortacsu and F. Tintelnot (2020), “The production relocation and price effects of US trade policy: the Case of Washing Machines,” American Economic Review 110(7): 2103-2127.  Frankel, J.A. and D.H. Romer (1999), “Does Trade Cause Growth,” American Economic Review 89 (3): 379-399. Handley, K., F. Kamal, and R. Monarch (2020), “Rising Import Tariffs, Falling Export Growth: When Modern Supply Chains Meet Old-Style Protectionism,” NBER Working paper 26611. https://www.nber.org/papers/w26611. Handley, K. and N. Limao (2022), “Trade Policy Uncertainty,” NBER Working Paper 29672.  Handley, Kyle, Fariha Kamal, and Ryan Monarch, “Rising Import Tariffs, Falling Export Growth: When Modern Supply Chains Meet Old-Style Protectionism,” National Bureau of Economic Research, NBER Working Paper No. 26611, January 2020. Jin, Keyu (2023). The New China Playbook: Beyond Socialism and Capitalism. New York: Viking. Kreuter, H. and M. Riccaboni (2023), “The Impact of Import Tariffs on GDP and Consumer Welfare: A Production Network Approach,” Journal of Economic Modelling 126.  Krugman, P. (1982), “The Macroeconomics of Protection with a Floating Exchange rate,” Carnegie-Rochester Conference Series on Public Policy 16: 141-182.  Ma, Xinru; Kang, David C. (2024). Beyond Power Transitions: The Lessons of East Asian History and the Future of U.S.-China Relations. Columbia Studies in International Order and Politics. New York: Columbia University Press.  McKibbin, W., M. Hogan, and M. Noland (2024), “The International Economic Implications of a Second Trump Presidency,” Peterson Institute for International Economics, Working Paper 24-20.  Mundell, R. (1961), “Flexible Exchange Rates and Employment Policy,” Canadian Journal of Economics and Political Science 27: 509-517.  Obstfeld, M., and K. Rogoff (1995), “Exchange Rate Dynamics Redux,” Journal of Political Economy, 103: 624-660.  Russ, Katheryn (December 16, 2019). “What Unilateralism Means for the Future of the U.S. Economy,” Harvard Business Review. January 2, 2020.  Zarroli, Jim. “Despite Trump’s Promises, The Trade Deficit is Only Getting Wider,” NPR. March 6, 2019.

Energy & Economics
Nottinghamshire, UK 03 April 2025 : Attitudes of UK broadsheet newspaper after Trump unleashes Liberation Day Tariff announcement

The EU at the Crossroads of Global Geopolitics

by Krzysztof Sliwinski

한국어로 읽기 Leer en español In Deutsch lesen Gap اقرأ بالعربية Lire en français Читать на русском Abstract This study examines the short-term, medium-term, and long-term implications of recent "tariff wars" on the European Union (EU). The imposition of tariffs by the United States, particularly the "Liberation Day" tariffs announced by President Trump on April 2, 2025, led to significant disruptions in global supply chains, negatively impacted GDP growth, increased financial market volatility, and exacerbated geopolitical tensions. The EU faces challenges in navigating this shifting geopolitical landscape while maintaining its economic interests and influence. However, the EU has opportunities to leverage these conflicts to strengthen its internal market, foster international cooperation, and emerge as a more resilient global actor. The paper concludes by discussing the potential end of transatlanticism, the future of the EU, and the implications for globalisation in light of the current "tariff chaos." Keywords: Tariffs, Geopolitics, European Union, Trade Wars Introduction Before we examine the topic of tariffs, let us recall that the terms "tariff war" or "trade war" are not strictly academic. International Security scholars generally believe that the notion of war is reserved for military conflicts (both domestic and international) that involve at least a thousand casualties in any given year.[1] One of the most prominent sources in this regard is the Armed Conflict Dataset Codebook, published by the Uppsala Conflict Data Program at the Department of Peace and Conflict Research, Centre for the Study of Civil Wars, and the International Peace Research Institute at Uppsala University in Uppsala.[2] Therefore, "tariff war" or "tariff wars" are more journalistic and hyperbolic. Hence, they are used in this study with quotation marks. Journalists and commentators from various backgrounds often use inflated language to impress their readers. On the other hand, wars are cataclysmic events that have game-changing consequences. In this sense, some tools that state leaders use to achieve political and economic goals, such as tariffs, may have short- and long-term outcomes. Nonetheless, scholars who tend to be precise in their explanations will mainly discuss economic competition rather than "economic war" or "wars." This study investigates the short-, medium-, and possible long-term implications of "tariff wars" on the European Union. These implications appear multifaceted and encompass stability, political relationships, and a broader international order."Liberation Day" On April 2, US President Trump announced new tariffs under the banner of "Liberation Day" – a minimum baseline of 10 per cent tariffs on goods imported from all foreign countries and higher, reciprocal tariffs on nations that impose tariffs on US exports.[3]  Crucially, the White House claims that the new tariffs are reciprocal: "It is the policy of the United States to rebalance global trade flows by imposing an additional ad valorem duty on all imports from all trading partners except as otherwise provided herein. The additional ad valorem duty on all imports from all trading partners shall start at 10 per cent, and shortly thereafter, the additional ad valorem duty shall increase for trading partners enumerated in Annex I to this order at the rates set forth in Annex I to this order. These additional ad valorem duties shall apply until such time as I determine that the underlying conditions described above are satisfied, resolved, or mitigated".[4] We did not have to wait for strong reactions to occur worldwide. China vowed to retaliate against the 34 per cent tariffs imposed by the US on Wednesday (April 2 2025) and protect its national interests while condemning the move as "an act of bullying".[5] Doubling down, a few days later, Trump threatened a 50 per cent tariff on China on top of previous reciprocal duties,[6] to which Chinese President Xi Jinping already replied hawkishly.[7] In an equally hawkish response, the Trump administration declared that Chinese goods would be subject to a 145 per cent tariff.[8] In a twist of events, on April 9, the US  declared a 90-day-long pause for previously declared tariffs covering the whole world (keeping a minimum of 10 per cent, though) except against China.[9] The next couple of weeks will show whether the world will enter the "tariff arms race" or we will enter some "tariff détente". Importantly, as one can surmise, "Xi has sold himself domestically and internationally as the guy standing up to America, and people that want to stand up to America should get in line behind Chairman Xi".[10] For the EU, European Commission President Ursula von der Leyen described US universal tariffs as a significant blow to the world economy and claimed that the European Union was prepared to respond with countermeasures if talks with Washington failed. Accordingly, the EU was already finalising a first package of tariffs on up to 26 billion Euro ($28.4 billion) of US goods for mid-April in response to US steel and aluminium tariffs that took effect on March 12.[11] Consequently, on April 7, 2025, a meeting was organised in Luxembourg[12] regarding the EU's response to US tariffs on steel and aluminium and the preparation of countermeasures, which included a proposal to impose 25 per cent tariffs on US goods. Interestingly, the "Liberation Day" tariffs do not include Russia. According to numerous commentators, this indicates Moscow's importance as a future trade partner once the Ukrainian war is over. However, the official explanation issued by the White House suggests that the existing sanctions against Russia "preclude any meaningful trade."[13] Tariff imposition: short, medium and long-term consequences Several observable phenomena can be identified regarding their economic ramifications: First, the imposition of tariffs can lead to significant disruptions in global supply chains, thereby affecting industries that rely heavily on international trade. This disruption can lead to increased costs and reduced competitiveness for EU businesses, particularly in sectors such as agriculture and manufacturing.[14] While national measures may yield political and economic benefits in the short term, it is essential to note that global prosperity cannot be sustained without cooperative and stable international trade policies. Second, the Gross Domestic Product is likely to be impacted. The imposition of tariffs has been shown to negatively affect GDP growth. For instance, the US-China "trade war" decreased the GDP of both countries, which could similarly affect the EU if it becomes embroiled in similar conflicts.[15] Third, we examine volatility in the financial markets. "Tariff wars" contribute to financial market volatility, which can cause a ripple effect on EU economic stability. This volatility can deter investment and slow economic growth.[16] Fourth, political targeting and retaliation. "Tariff wars" often involve politically targeted retaliations, as seen in the US-China trade conflict. The EU has been adept at minimising economic damage while maximising political targeting, which could influence its future trade strategies and political alliances.[17] Fifth, global alliances are shifting. The EU may need to reconsider its trade alliances and partnerships in response to these shifting dynamics. This could involve forming new trade agreements or strengthening existing ones to mitigate the impact of "tariff wars."[18] Next, increased geopolitical competition and economic nationalism can exacerbate tensions between major powers, potentially leading to a crisis in globalization. As an aspiring global player, the EU must navigate these tensions carefully to maintain its influence and economic interests.[19] Social impacts should also be considered. "Trade wars" can lead to changes in employment and consumer prices, thus affecting the EU's social equity and economic stability. These changes necessitate policies that enhance social resilience and protect vulnerable populations.[20] Does Team Trump have a plan? The tariffs imposed by the Trump administration appear to be part of a broader strategy that Trump describes as a declaration of economic independence for the US, notably heralding them as part of the national emergency. The long-term effects of this strategy depend on how effectively the US can transition to domestic production without facing significant retaliation or trade barriers from other nations. Notably, the US dollar's status as the world's primary reserve currency has been supported by military power since the introduction of the Bretton Woods system. The US military, especially the US Navy, has helped secure trade routes, enforce economic policies, and establish a framework for international trade, favouring the US. dollar. The countries that subscribed to the system also gained access to the US consumer market. Importantly, what is explained by the Triffin Dilemma, back in the 1960s, the US had a choice: to either increase the supply of the US Dollar,  sought after by the whole world as a reserve currency and international trade currency and that way to upkeep global economic growth, which was pivotal for the US economy or to end the gold standard. In 1971, the US finished its Bretton Woods system. What followed was a new system primarily dictated by neoliberalism based on low tariffs, free capital movement, flexible exchange rates and US security guarantees.[21] Under that neoliberal system, reserve demand for American assets has pushed up the dollar, leading it to levels far in excess of what would balance international trade over the long run.[22] This made manufacturing in the US very expensive, and consequently, the deindustrialisation of the US followed. Therefore, it appears that Trump wants to keep the US dollar as the world's reserve currency and reindustrialise the US. According to Stephen Miran, chair of the Council of Economic Advisers (a United States agency within the Executive Office of the President), two key elements to achieve this goal are tariffs and addressing currency undervaluation of other nations.[23] The second element in that duo is also known as the Mar-a-Lago Accord.[24] Scott Bessent, 79th US Secretary of the Treasury, picked up this argument.[25] In a nutshell, the current "tariff chaos" is arguably only temporary, and in the long term, it is designed to provide an advantage for the US economy.A readjustment of sorts fundamentally reshapes the existing international political economy. Whether or not this plan works and achieves its goals is entirely different. As market analysts observe, "For the past two decades, the US has focused on high-tech services like Amazon and Google services, which have added to a service surplus. However, the real sustainable wealth comes from the manufacturing of goods, which, for the US, went from 17 per cent in 1988 to 10 per cent in 2023 of GDP. The entire process of building goods creates many mini ecosystems of production/capital value that stay in a country for many decades. […] Initially, the Chinese started in low-tech and low-cost labour manufacturing before 2001, but shifted towards becoming major manufacturers of high-tech products like robotics and EV automobiles. […] For President Trump to levy high tariffs on the Chinese in the current moment, he is doing everything that he can to resuscitate US manufacturing".[26] EU's options The EU and the US share the world's largest bilateral trade and investment relationship, with 2024 data showing EU exports to the US at 531.6 billion euros and imports at 333.4 billion euros, resulting in a 198.2 billion Euro trade surplus for the EU.[27] While the EU faces significant challenges due to "tariff wars," there are potential opportunities for positive outcomes. The EU can leverage these conflicts to strengthen its internal market and enhance its role in global trade. By adopting proactive trade policies and fostering international cooperation, the EU can mitigate the negative impacts of "tariff wars" and potentially emerge as a more resilient and influential global actor. However, this requires careful navigation of the complex geopolitical landscape and a commitment to maintaining open and cooperative trade relations. It seems likely that the EU can leverage recent US tariffs to strengthen ties with China and India, potentially reducing its dependency on US trade. China is the EU's second-largest trading partner for goods, with bilateral trade at 739 billion euros in 2023, though a large deficit favouring China (292 billion euros in 2023).[28] The EU's strategy is to de-risk, not decouple, focusing on reciprocity and reducing dependencies; however, competition and systemic rivalry complicate deeper ties. Meanwhile, India's trade with the EU was 124 billion euros in goods in 2023, and ongoing free trade agreement (FTA) negotiations, expected to conclude by 2025, could yield short-term economic gains of 4.4 billion euros for both.[29] India's fast-growing economy and shared interest in technology make it a potentially promising partner. EU and China: Opportunities and Challenges Economically, there are more opportunities than challenges. China remains the EU's second-largest trading partner for goods, with bilateral trade reaching 739 billion euros in 2023, down 14 per cent from 2022 due to global economic shifts.[30] The trade balance shows a significant deficit of 292 billion euros in 2023, driven by imports of telecommunications equipment and machinery, whereas EU exports include motor cars and medicaments. The EU's strategy, outlined in its 2019 strategic outlook and reaffirmed in 2023, positions China as a partner, competitor, and systemic rival, focusing on de-risking rather than decoupling. Recent actions, such as anti-dumping duties on Chinese glass fibre yarns in March 2025, highlight tensions over unfair trade practices. Despite these challenges, China's market size offers opportunities, especially if the EU can negotiate for better access. However, geopolitical rivalry complicates deeper ties, including EU probes, in Chinese subsidies. Politically, the EU and China differ significantly in this regard. Regarding human rights policies, the EU consistently raises concerns about human rights issues in China.[31] These concerns often lead to friction, with the European Parliament blocking trade agreements and imposing sanctions on them. Moreover, China's stance on the war in Ukraine has created tension, with the EU viewing Russia as a major threat, and China's support of Russia is a significant concern.[32] China is often perceived in Western European capitals as not making concessions on issues vital to European interests.[33] The understanding of the war's root causes, the assessment of implications, risks or potential solutions - in all these areas, the Chinese leadership on the one hand and the European governments and the EU Commission in Brussels on the other hand have expressed very different, at times even contrary, positions.[34] Finally, China's political model demonstrates that democracy is not a prerequisite for prosperity, challenging Western emphasis on democracy and human rights.[35] EU and India: Growing Partnership and FTA Prospects and Political Challenges Economically, it seems that there are more opportunities than challenges. India, ranked as the EU's ninth-largest trading partner, accounted for 124 billion euros in goods trade in 2023, representing 2.2 per cent of the EU's total trade, with growth of around 90 per cent over the past decade.[36] Services trade reached nearly 60 billion euros in 2023, almost doubling since 2020, with a third being digital services.[37] The EU is India's largest trading partner, and ongoing negotiations for a free trade agreement (FTA), investment protection, and geographical indications, initiated in 2007 and resuming in 2022, aim for conclusion by 2025.[38] A 2008 trade impact assessment suggests positive real income effects, with short-term gains of 3–4.4 billion euros for both parties. The EU seeks to lower Indian tariffs on cars, wine, and whiskey. Simultaneously, India has pushed for market access to pharmaceuticals and easier work visas for IT professionals. However, concerns remain regarding the impact of EU border carbon taxes and farm subsidies on Indian farmers. Politically, challenges to EU-India relations stem from several sources. Trade has been a persistent friction point, with negotiations for a free trade agreement facing roadblocks (Malaponti, 2024). Despite the EU being a significant trading partner for India,[39] differing approaches to trade liberalization have hindered progress. India's historical emphasis on autonomy and self-reliance can sometimes clash with the EU's multilateral approach.[40] Further, India's complex relationship with Russia, particularly its continued reliance on Russian defence technology, presents a challenge for closer EU-India security cooperation.[41] Finally, while the EU and India share concerns about China's growing influence, their strategies for managing this challenge may differ. These issues, if left unaddressed, could limit the potential for a deeper, more strategic partnership between the EU and India.[42] Conclusions "What does Trump want? This question is on the minds of policymakers and experts worldwide. Perhaps we are witnessing the opening salvo of a decisive phase of the US-China economic conflict - the most serious conflict since 1989. It is likely the beginning of the end of the ideology of Globalism and the processes of globalisation. It is arguably aggressive "decoupling" at its worst and the fragmentation of the world economy. For the EU, this is a new situation which dictates new challenges. Someday, probably sooner than later, European political elites will have to make a choice. To loosen or perhaps even end the transatlantic community and go against the US. Perhaps in tandem with some of the BRICS countries, such as India and China, or swallow the bitter pill, redefine its current economic model, and once again gamble with Washington, this time against the BRICS. It seems that the EU and its member states are at a crossroads, and their next choice of action will have to be very careful. In a likely new "Cold War" between the US and this time, China, the EU might not be allowed to play the third party, neutral status. One should also remember that Trump, like Putin or Xi, likes to talk to EU member states' representatives directly, bypassing Brussels and unelected "Eureaucrats' like Ursula Von der Leyen. In other words, he tends to leverage his position against the unity of the EU, which should not be surprising given the internal EU conflicts. More often than not, Hungary, Slovakia, Italy, or Nordic members of the EU clash on numerous Issues with Berlin, Paris and most importantly, Brussels. (I write more about it here: Will the EU even survive? Vital external and internal challenges ahead of the EU in the newly emerging world order. https://worldnewworld.com/page/content.php?no=4577).   References [1] See more at:  For detailed information, consult one of the most comprehensive databases on conflicts run by Uppsala Conflict Data Programme at: https://ucdp.uu.se/encyclopedia[2] Pettersson, Therese. 2019. UCDP/PRIO Armed Conflict Dataset Codebook, Version 19.1. Uppsala Conflict Data Program, Department of Peace and Conflict Research, Uppsala University, and Centre for the Study of Civil Wars, International Peace Research Institute, Oslo. https://ucdp.uu.se/downloads/ucdpprio/ucdp-prio-acd-191.pdf[3] Regulating Imports with a Reciprocal Tariff to Rectify Trade Practices that Contribute to Large and Persistent Annual United States Goods Trade Deficits. https://www.whitehouse.gov/presidential-actions/2025/04/regulating-imports-with-a-reciprocal-tariff-to-rectify-trade-practices-that-contribute-to-large-and-persistent-annual-united-states-goods-trade-deficits/[4] Regulating Imports with a Reciprocal Tariff to Rectify… op. cit.[5] Hanin Bochen, and Ziwen Zhao. "China vows to retaliate after 'bullying' US imposes 34% reciprocal tariffs". South China Morning Post. April 3 2025. https://www.scmp.com/news/us/diplomacy/article/3304971/trump-announced-34-reciprocal-tariffs-chinese-goods-part-liberation-day-package[6] Megerian, Chris and Boak, Josh. "Trump threatens new 50% tariff on China on top of 'reciprocal' duties". Global News. April 7, 2025. https://globalnews.ca/news/11119347/trump-added-50-percent-tariff-china/[7] Tan Yvette, Liang Annabelle and Ng Kelly. "China is not backing down from Trump's tariff war. What next?". BBC, April 8 2025. https://www.bbc.com/news/articles/ckg51yw700lo[8] Wong, Olga. “Trump further raises tariffs to 120% on small parcels from mainland, Hong Kong”. South China Morning Post, 11 April 2025. https://www.scmp.com/news/hong-kong/hong-kong-economy/article/3306069/trump-further-raises-tariffs-120-small-parcels-mainland-hong-kong?utm_source=feedly_feed[9] Chu, Ben. “ What does Trump's tariff pause mean for global trade?”, BBC, 10 April, 2025. https://www.bbc.com/news/articles/cz95589ey9yo[10] Wu, Terri. "Why US Has Upper Hand Over Beijing in Tariff Standoff". The Epoch Times April 7, 2025. https://www.theepochtimes.com/article/why-us-has-upper-hand-over-beijing-in-tariff-standoff-5838158?utm_source=epochHG&utm_campaign=jj  [11] Blenkinsop, Philip, and Van Overstraeten, Benoit. "EU plans countermeasures to new US tariffs, says EU chief." April 3, 2025. https://www.reuters.com/markets/eu-prepare-countermeasures-us-reciprocal-tariffs-says-eu-chief-2025-04-03/[12] Payne, Julia. The EU Commission proposes 25% counter-tariffs on some US imports, document shows". Reuters, April 8, 2025. https://www.reuters.com/markets/europe/eu-commission-proposes-25-counter-tariffs-some-us-imports-document-shows-2025-04-07/  [13] Bennett, Ivor. "US seems content to cosy up to Russia instead of imposing tariffs." Sky News, April 4, 2025. https://news.sky.com/story/us-seems-content-to-cosy-up-to-russia-instead-of-coerce-it-with-tariffs-13341300[14] Angwaomaodoko, Ejuchegahi Anthony. "Trade Wars and Tariff Policies: Long-Term Effects on Global Trade and Economic Relationship." Business and Economic Research, 14, no. 4 (October 27, 2024): 62. https://doi.org/10.5296/ber.v14i4.22185[15] Ilhomjonov, Ibrohim, and Akbarali Yakubov. "THE IMPACT OF THE TRADE WAR BETWEEN CHINA AND THE USA ON THE WORLD ECONOMY," June 16, 2024. https://interoncof.com/index.php/USA/article/view/2112[16] Angwaomaodoko, Ejuchegahi Anthony. "Trade Wars and Tariff Policies: Long-Term Effects on Global Trade and Economic Relationship." Business and Economic Research 14, no. 4 (October 27, 2024): 62. https://doi.org/10.5296/ber.v14i4.22185[17] Fetzer, Thiemo, and Schwarz Carlo. "Tariffs and Politics: Evidence from Trump's Trade Wars." Economic Journal 131: no. 636 (May 2021): 1717–41. https://doi.org/10.1093/ej/ueaa122[18] Angwaomaodoko, Ejuchegahi Anthony. "Trade Wars and Tariff Policies: Long-Term Effects on Global Trade and Economic Relationship …op. cit.[19] Mihaylov, Valentin Todorov, and Sławomir Sitek. 2021. "Trade Wars and the Changing International Order: A Crisis of Globalisation?" Miscellanea Geographica 25: 99–109. https://doi.org/10.2478/mgrsd-2020-0051[20] Wheatley, Mary Christine. "Global Trade Wars: Economic and Social Impacts." PREMIER JOURNAL OF BUSINESS AND MANAGEMENT, November 5, 2024. https://premierscience.com/wp-content/uploads/2024/11/pjbm-24-368.pdf[21] Money & Macro, https://www.youtube.com/watch?v=1ts5wJ6OfzA&t=572s[22] Miran, Stephen. "A User's Guide to Restructuring the Global Trading System." November 2024. Hudson Bay Capital. https://www.hudsonbaycapital.com/documents/FG/hudsonbay/research/638199_A_Users_Guide_to_Restructuring_the_Global_Trading_System.pdf[23] Miran, Stephen. "A User's Guide to Restructuring the Global Trading System"... op.cit.[24] Zongyuan Zoe Liu, "Why the Proposed Mar-a-Lago Accord May Not be the Magic Wand That Trump Is Hoping For", 9  April 2025. https://www.cfr.org/blog/why-proposed-mar-lago-accord-may-not-be-magic-wand-trump-hoping  [25] Treasury Secretary Scott Bessent Breaks Down Trump's Tariff Plan and Its Impact on the Middle Class. https://www.youtube.com/watch?v=zLnX1SQfgJI[26] Park, Thomas. https://www.linkedin.com/feed/update/urn:li:activity:7316122202846765056/[27] See more at: https://ec.europa.eu/eurostat/fr/web/products-eurostat-news/w/ddn-20250311-1[28] See more at: https://policy.trade.ec.europa.eu/eu-trade-relationships-country-and-region/countries-and-regions/china_en[29] Kar, Jeet. "The EU and India are close to finalising a free trade agreement. Here's what to know." World Economic Forum. March 7 2025. https://www.weforum.org/stories/2025/03/eu-india-free-trade-agreement/[30] See more at: https://policy.trade.ec.europa.eu/eu-trade-relationships-country-and-region/countries-and-regions/china_en[31] "The paradoxical relationship between the EU and China'. Eastminster: a global politics & policy blog, University of East Anglia. http://www.ueapolitics.org/2022/03/29/the-paradoxical-relationship-between-the-eu-and-china/[32] Vasselier, Abigaël. "Relations between the EU and China: what to watch for in 2024". January 25 2025. https://merics.org/en/merics-briefs/relations-between-eu-and-china-what-watch-2024 [33] Benner, Thorsten. "Europe Is Disastrously Split on China." Foreign Policy, April 12 2023. https://foreignpolicy.com/2023/04/12/europe-china-policy-brussels-macron-xi-jinping-von-der-leyen-sanchez/[34] Chen, D., N. Godehardt, M., Mayer, X., Zhang. 2022. "Europe and China at a Crossroads." 2022. https://thediplomat.com/2022/03/europe-and-china-at-a-crossroads.[35] Sharshenova, A. and Crawford. 2017. "Undermining Western Democracy Promotion in Central Asia: China's Countervailing Influences, Powers and Impact." Central Asian Survey 36 (4): 453. https://doi.org/10.1080/02634937.2017.1372364.[36] See more at: https://policy.trade.ec.europa.eu/eu-trade-relationships-country-and-region/countries-and-regions/india_en[37] See more at: https://digital-strategy.ec.europa.eu/en/news/key-outcomes-second-eu-india-trade-and-technology-council[38] Kar, Jeet. "The EU and India are close to finalising a free trade agreement. Here's what to know"… op. cit.[39] Malaponti, Chiara. 2024. “Rebooting EU-India Relations: How to Unlock Post-Election Potential.” https://ecfr.eu/article/rebooting-eu-india-relations-how-to-unlock-post-election-potential/.[40] Sinha, Aseema, and Jon P. Dorschner. 2009. “India: Rising Power or a Mere Revolution of Rising Expectations?” Polity 42 (1): 74. https://doi.org/10.1057/pol.2009.19.[41] Chandrasekar, Anunita. 2025. “It’s Time to Upgrade the EU-India Relationship.” https://www.cer.eu/insights/its-time-upgrade-eu-india-relationship.[42] Gare, Frédéric and Reuter Manisha. “Here be dragons: India-China relations and their consequences for Europe”. 25 May 2023. https://ecfr.eu/article/here-be-dragons-india-china-relations-and-their-consequences-for-europe/

Energy & Economics
 March 28, 2018, the US and Chinese flags and texts at a studio in Seoul, Korea. An illustrative editorial. trade war

International trade war - Spice Road against Silk Road

by Joon Seok Oh

한국어로 읽기 Leer en español In Deutsch lesen Gap اقرأ بالعربية Lire en français Читать на русском AbstractPurpose The purpose of this paper is to analyse the international political economy of Korea and its effects due to geopolitical tension between China and the USA. Design/methodology/approach Economic war between China and the USA has prolonged longer than expected. Aftermath of the COVID-19 pandemic, reforming the supply chain has been the centre of economic tension between China and the USA. Quite recently, with the rapid expansion of Chinese e-commerce platforms, distribution channels come upon a new economic tension between the two. And now is the time to pivot its pattern of conflict from competition into cooperation. In this end, economic diplomacy could be a useful means to give a signal of cooperation. From the view of economic diplomacy, this paper tries to analyse the projected transition of economic war between China and the USA with its implication on the trade policy of Korea. Findings As an implementation of economic diplomacy, China suggested the Belt and Road Initiative (BRI), enhancing trade logistics among related countries to gain competitiveness. In 2023, the Biden administration suggested the India-Middle East and Europe Economic Corridor as a counter to BRI, which will be a threshold for changing trade policy from economic war into economic diplomacy. As a result, it is expected China and the USA will expand their economic diplomacy in a way to promote economic cooperation among allied states, while the distribution channel war would continue to accelerate the economic tension between China and the USA. Korea has to prepare for and provide measures handling this geopolitical location in its trade policy or economic diplomacy. Originality/value This research contributes to the awareness and understanding of trade environments from the perspective of economic diplomacy. 1. Introduction The advent of globalisation has led to widespread economic integration, creating global production networks and markets. However, the COVID-19 pandemic has acted as a significant setback to this trend. In the wake of COVID-19, an economic war has arisen between China and the USA, centred on the restructuring of global supply chains following widespread disruptions. International political economy (IPE) examines the power dynamics between states and the structures of influence within regional economies. Consequently, economic diplomacy has gained unprecedented attention. Economic diplomacy focuses on government actions regarding international economic issues, distinct from political diplomacy through its market-oriented approach in foreign policy. Putnam (1988) categorises economic diplomacy into two levels: unilateralism and bilateralism. Unilateral economic diplomacy (or unilateralism) often relies on hard power, involving decisions on trade liberalisation or market protection without negotiation. Bilateral economic diplomacy (or bilateralism) or multilateral economic diplomacy (or multilateralism), by contrast, involves negotiation among trade partners, resulting in agreements such as regional or global free trade agreements (FTAs). A vast range of state or non-state actors engage in economic diplomacy, navigating the complex interplay between international and domestic factors. Defining economic diplomacy is extremely challenging, but one useful definition is “the broad concept of economic statecraft, where economic measures are taken in the pursuit of political goals, including punitive actions such as sanctions” (Blanchard and Ripsman, 2008).  Figure 1 Recent trend of economic diplomacy To exert influence internationally, ministers and heads of government strive to demonstrate their capacity for national security through two primary approaches, as shown in Figure 1 (above): economic war (or competition) and economic diplomacy (or international cooperation). In the context of global supply chain restructuring, the economic conflict between China and the USA has intensified, marked by threats of supply chain disruptions. This has led to emerging strategies aimed at “crowding out” the USA from global supply chains (去美戰略) or excluding China through alliances such as the Allied Supply Chain and Chip 4. While economic war is inherently “temporary” due to its painstaking nature, economic diplomacy or international cooperation offer a more “long-term” approach because it is gains-taking. This paper analyses the factors contributing to the prolonged nature of this economic war and explores potential outcomes of the supply chain tensions between China and the USA from the perspectives of IPE or geo-economics. In conclusion, it highlights the importance of preparing for trade policy adjustments and strategic economic diplomacy. 2. International trade war and strategic items2.1 Supply chain The supply chain encompasses a network of interconnected suppliers involved in each stage of production, from raw materials and components to the finished goods or services. This network can include vendors, warehouses, retailers, freight stations and distribution centres. Effective supply chain management is a “crucial process because an optimised supply chain results in lower costs and a more efficient production cycle” [1]. Within the supply chain, a leading company typically holds governance power, enabling it to coordinate scheduling and exercise control across the interconnected suppliers, resulting in reduced costs and shorter production times (Gereffi et al., 2005) [2]. Since the 2000s, forward and backward integration have been key strategies for managing time, cost and uncertainty in supply chains. For example, Toyota’s Just-In-Time (JIT) system demonstrated the efficiency of locally concentrated supply chains until disruptions from the 2011 East Japan Earthquake and the Thailand flood. Following supply chain shutdowns in 2020, many businesses shifted from local to global supply chains, utilising advancements of the information technology (IT) and transportation technologies to geographically diversify operations. As the need for a systematically functioning global supply chain has grown, a leading nation, much like a leading company, often assumes governance power in international trade and investment, as illustrated in Figure 2 (below), by aligning with the leadership of a dominant market competitiveness, which makes this leadership valuable.  Figure 2 Supply chain The COVID-19 pandemic dealt a severe blow to the global supply chain, causing sudden lockdowns that led to widespread supply chain disruptions. To mitigate the risks of future global disruptions, supply chains have begun restructuring to operate on a more regionally segmented basis. In this shift toward regional supply chains, China and the USA are at the centre, drawing allied countries within their spheres of influence. This alignment helps explain why the economic war between China and the USA has lasted longer than anticipated. 2.2 Strategic items China has restricted exports of two rare metals, gallium and germanium, which are critical to semiconductor production. Kraljic (1983) highlighted the importance of managing “strategic items” within the framework of supply chain management, as shown in Figure 3. Kraljic emphasises the need to strengthen and diversify critical items. The Kraljic matrix provides a valuable tool for identifying essential items that require focused management within the supply chain.  Figure 3 Kraljic matrix Kraljic identified the importance of managing “bottleneck items” in strategic supply chain management – items that present high supply risk but have relatively low business value. Due to the potential costs associated with non-delivery or compromised quality of strategic items, these must be closely monitored and controlled. From a risk management perspective, establishing medium-term business relationships and collaboration with suppliers is essential. For example, South Korea imports over 90% of its urea for agricultural and industrial purposes from China [3]. Heavily dependent on China for urea supplies due to pricing factors, Korea faced challenges when China imposed export controls on urea, underscoring Korea’s vulnerability within China’s sphere of influence. The European Union (EU) also faces challenges with critical raw materials (CRMs). China remains the EU’s sole supplier of processed rare earth elements, while Chile supplies 79% of its lithium. In response, the EU introduced the CRM Act (CRMA) to support projects aimed at increasing “the EU’s capacity to extract, process, and recycle strategic raw materials and diversify supplies from the third countries” [4]. 2.3 Resilient supply chain alliance In contrast to China’s approach of leveraging supply disruptions to strengthen its influence, the Biden administration in the USA has adopted a cooperative approach focused on building resilient supply chains (Pillar 2) through the Indo-Pacific Economic Framework (IPEF), which includes 14 member countries [5]. The need for resilient supply chains has been further underscored by the Russia–Ukraine crisis. The IPEF aims to address supply chain vulnerabilities by fostering global efforts to reduce risks associated with concentrated, fragile supply chains [6].  Figure 4 Resilient supply chain alliance In Figure 4, the EU Commission presented the Single Market Emergency Instrument (SMEI) in September 2022, a crisis governance framework designed to ensure the availability of essential goods and services during future emergencies. The SMEI operates on three levels: contingency planning, vigilance and emergency. The contingency planning phase focuses on collaboration among member states to mitigate supply chain disruption and monitor incidents. The vigilance phase can be activated when a significant disruption is anticipated, enabling specific measures such as mapping and monitoring supply chains and production capacities. Finally, the emergency phase is activated in cases of severe disruption to the functioning of the single market [7]. Establishing a resilient supply chain through international cooperation may be appealing, yet the reality often falls short of the ambition. In South Korea, the IPEF took effect on 17 April 2024, after an extended negotiation process, marking the first multilateral agreement on supply chains. As a result, during non-crisis periods, the 14 member countries will collaborate to strengthen international trade, investment and trade logistics. In times of crisis, member countries will activate a “crisis response network”. Conversely, opportunities for negotiation with China, South Korea’s largest trading partner, are essential for building supply chain resilience [8]. China has pursued an industrial policy focused on enhancing its supply chain management capabilities. In the semiconductor sector, the decoupling between China and the USA has become increasingly evident. Contrary to expectations, China has adopted a policy of internalising its supply chains, returning to the integration strategies of the 2000s rather than furthering globalisation. A promising opportunity for transformation between the two countries has emerged recently. Since 2015, China and South Korea have maintained bilateral FTA, and with the second phase of FTA negotiations currently underway, there is an opportunity to strengthen trade and investment ties, fostering positive progress through international cooperation. 2.4 China manufacturing exodus During the COVID-19 pandemic, China imposed sudden lockdowns without prior notice or preparation, halting production and logistics cycles. This “zero COVID” policy may have triggered a shift towards “de-risking” China from supply chain disruptions. Although China still offers significant advantages as “the factory of the world,” with vast market potential, prolonged trade tensions with the USA, intensified during the Trump administration, have prompted global manufacturers with substantial USA market bases to relocate operations amid rising geopolitical uncertainties. For example, Nike and Adidas have shifted much of their footwear manufacturing to Vietnam, Apple has begun iPhone production at a Foxconn in Chennai, India, and AstraZeneca has contracted production with India’s Serum Institute. In the pre-globalised era, defining the Rule of Origin (ROO) was straightforward, as a product’s components were usually manufactured and assembled within a single country. However, with the complexity of global supply chains, particularly since 2012, determining ROO has become a time-consuming and subjective process. ROO are classified as either non-preferential or preferential. The USA applies non-preferential ROO to restrict imports from countries like Cuba, Iran and North Korea, while offering trade preference programmes for others. Preferential ROO are used to determine duty-free eligibility for imports from approved countries [9], whereas non-preferential ROO play a crucial role in “country of origin labelling, government procurement, enforcement of trade remedy actions, compilation of trade statistics, supply chain security issues.” [10] China manufacturing exodus may negatively impact capital inflows into Hong Kong, traditionally seen as the Gateway to China. In 2023, Hong Kong’s initial public offering volume fell to a 20-year low of $5.9bn [11]. While China-oriented business remains in Hong Kong, which returns fully to Chinese control in 2047, non-China-oriented businesses have migrated to Singapore. As the certainty of contract and ownership rights forms the foundation of capitalism, this capital flight from Hong Kong is likely to persist. 3. Trade logistics and economic corridors Globalisation has allowed supply chains to leverage interdependence and interconnectedness, maximising efficiency. However, while these efficiencies have been beneficial, they have also created a fertile ground for friction between trade partners due to a “survival of the fittest” mindset and the principle of “winner takes all.” This interdependence has also highlighted vulnerabilities; the global supply chain struggled to manage the disruptions caused by COVID-19, prompting a shift towards regional integration initiatives, such as Association of Southeast Asian Nations, Regional Comprehensive Economic Partnership, United States–Mexico–Canada Agreement and Comprehensive and Progressive Agreement for Trans-Pacific Partnership. As the global economy seeks stability, collaboration over competition has become increasingly essential, with economic diplomacy emerging as a priority. The prolonged economic war between China and the USA arguably needs to shift towards economic diplomacy. The global supply chain is restructuring into regional supply chains, building resilience by operating in regional segments that can withstand crises. Michael Porter introduced the concept of value chain as “a set of activities that a firm performs to deliver a valuable product or service to the market.” [12] Complex finished goods often depend on global value chains, traversing multiple countries. As shown in Figure 5, the value chain consists of supply chain and trade channel components. While the focus has traditionally been on which country holds lead status within a regional supply chain, the emphasis is now shifting to how these regional segments can be interconnected and relayed. In this context, the supply chain competition may evolve into a “channel war” in international trade, where trade logistics will centre on the internal flow of goods, standardising channel processes and establishing authority over these channels.  Figure 5 Supply chain v. trade channel 3.1 Trade logistics It is natural for governments to seek environments that enhance competitiveness within in their countries. In terms of trade, effective trade logistics are essential for maintaining competitive advantage. As a prerequisite, a strong IT management infrastructure is indispensable. As shown in Figure 6, trade logistics encompass the internal flow of goods to market, integrating physical infrastructure with operating software – such as transport hubs, warehouses, highways, ports, terminals, trains and shipping vessels. Key areas of conflict in trade logistics involve the standardisation of channel processes and determining who holds governance over operation of these logistics systems. This is equally relevant within the digital economy. Recently, Chinese e-commerce – often referred to as C-commerce – has aggressively sought to gain control over digital distribution channels, interconnected delivery networks and trade logistics via digital platforms. Chinese platforms such as Taobao, Temu and AliExpress are actively working to increase their monthly active users (MAUs), positing themselves as counterweights to USA-based platforms such as Amazon and eBay in digital trade [13].  Figure 6 Trade logistics When the agenda of establishing international trade logistics is introduced to relevant trade members across various countries, initial progress and effective responses are often achieved. However, efforts soon encounter obstacles related to standardising logistics processes and establishing operational governance. Greater reliance on international institutions could help resolve these issues (Bayne, 2017). Yet governments frequently prioritise domestic interests, and after prolonged negotiations, the risk of international agreements failing increases. Amid the economic war between China and the USA, China launched a trade logistics initiative known as the Belt and Road Initiative (BRI), or One Belt One Road, in 2013. Often referred to as the New Silk Road, the BRI aims to establish economic corridors for trade logistics. The World Bank estimates that the BRI could boost trade flows by 4.1% and reduce trade costs by 1.1% [14]. In response, the Biden administration proposed the India-Middle East and Europe Economic Corridor (IMEC) in September 2023 to strengthen transport and communication links between Europe and Asia as a countermeasure to China’s BRI. IMEC has been well received by participating countries, with expectations of fostering economic growth, enhancing connectivity and potentially rebalancing trade and economic relations between the EU and China [15]. Both BRI and IMEC are ambitious projects aimed at boosting international trade through substantial investments in trade logistics infrastructure. Each seeks to assert governance over international trade channels, signalling that the supply chain war may soon evolve into a trade channel war between China and the USA. 3.2 Economic corridors Economic corridors are transport networks designed to support and facilitate the movement of goods, services, people and information. These corridors often include integrated infrastructure, such as highways, railways and ports, linking cities or even countries (Octaviano and Trishia, 2014). They are typically established to connect manufacturing hubs, high-supply and high-demand areas, and producers of value-added goods. Economic corridors comprise both hard infrastructure – such as trade facilities – and soft infrastructure, including trade facilitation and capacity-building measures. The Asian Development Bank introduced the term “economic corridor” in 1998 to describe networks connecting various economic agents within a region [16]. Economic corridors are integrated trade logistics networks, providing essential infrastructure for connecting regional segments of supply chains. As supply chains increasingly operate in regional “chunks,” linking these segments becomes ever more important. Economic corridors typically include a network of transport infrastructure, such as highways, railways, terminals and ports. Initiatives like the BRI and IMEC use economic corridors as instruments of economic diplomacy, shifting strategies from hard power to soft power, as shown in Figure 7. Because less-developed or developing countries often lack sufficient funding to invest in trade logistics, they tend to welcome these initiatives from developed countries, which offer international collaboration and support. However, these initiatives usually come with the condition that participating countries must accept standardised trade processes and governance led by the sponsoring developed country.  Figure 7 Economic corridor initiatives as economic diplomacy To succeed, economic corridors must meet three key conditions [17]. First, government intervention is essential, as economic corridor initiatives primarily involve public infrastructure investments beyond the scope of the private sector. In realising these projects, governments must reconcile three tensions to ensure their policies are mutually supportive: tensions between politics and economics, between international and domestic pressures and between governments and other stakeholders. Second, intermediate outcomes should be measured and demonstrated as results of economic corridors, allowing participants to experience tangible benefits throughout these longer-term projects. Finally, economic corridors should deliver broader benefits. Participants need incentives to utilise the infrastructure sustainably. These benefits may extend beyond economic welfare, such as wages and income, to include social inclusion, equity and environmental gains, which support the long-term viability of the infrastructure. 4. BRI vs IMEC4.1 Belt and Road Initiative (BRI) - Silk Road The BRI can be a modern-day realisation of the Silk Road concept, connecting Europe as a market base with China as a production base. Unlike the ancient Silk Road, which connected trade routes across Eurasia, the BRI poses potential challenges due to its extensive connectivity. Firstly, there are social and environmental externalities, such as increased congestion and accidents from concentrating traffic flows through limited links and nodes within trade networks. Secondly, while the connectivity may benefit the production and market bases at either end, regions situated between these hubs, through which highways and railways pass, may gain minimal advantage. Thirdly, there is often a mismatch between where costs and benefits are realised. Transit regions that facilitate network traffic often see fewer direct benefits compared to high-density nodes within the network. 4.2 India-Middle East and Europe Economic Corridor (IMEC) - The Spice Road The ancient Spice Roads once connected the Middle East and Northeast Africa with Europe, facilitating the exchange of goods such as cinnamon, ginger, pepper and cassia, which, like silk, served as a form of currency. The IMEC proposes a modern route from India to Europe through the United Arab Emirates (UAE), Saudi Arabia, Israel and Greece. Since its announcement in September 2023, some regional experts have expressed reservations about its feasibility, particularly regarding the connection between the Middle East and Israel. The project has faced delays due to the Israel–Hamas war. Despite these challenges, IMEC holds potential to drive economic growth and strengthen connectivity, especially as countries like Vietnam and India emerge as alternative manufacturing bases for companies relocating from China. For Saudi Arabia and the UAE, IMEC is not viewed as a challenge to China but rather as an opportunity to diversify their economies and solidify their roles within the Middle East region [18]. 5. Conclusion A new trade war between China and the USA has begun, with the Biden Administration’s introduction of IMEC as a counter to China’s BRI. This shift could soon transform the nature of economic war from a focus on supply chains to one on trade channels. The China manufacturing exodus was further accelerated by supply disruptions during the COVID-19 pandemic. Amidst the economic tensions between China and the USA, the restructuring of global supply chains into regional networks has made significant progress. With China maintaining its stance on export controls for strategic items, South Korea must prepare for resilient supply chain management. In relation to China–Korea FTA, which is currently undergoing its second phase of negotiation, South Korea should seek clarity on the transparency of China’s strategic item controls. The Committee on Foreign Investment in the United States (CFIUS) plays a key role in monitoring the quality of inbound investments; similarly, South Korea is experiencing increased inbound investment due to the manufacturing shift from China and should apply similar standards to evaluate investment quality. This emerging economic war between China and the USA is now marked by the competing initiatives of the BRI and IMEC. The BRI can be viewed as a modern Silk Road, linking China with Europe, while the IMEC seeks to establish a trade logistics corridor connecting Saudi Arabia, the UAE, Israel and Greece. The South Korean Government should take proactive steps to prepare for the evolving dynamics of the trade war between China and the USA. CitationOh, J.S. (2025), "International trade war - Spice Road against Silk Road", International Trade, Politics and Development, Vol. 9 No. 1, pp. 2-11. https://doi.org/10.1108/ITPD-06-2024-0031  Notes 1. https://www.investopedia.com/terms/s/supplychain.asp2. According to Gary Gereffi et al, 5 governance types of a lead company could be categorised as market, modular, relational, captive and hierarchy.3. Korea imports urea from 12 countries including Qatar, Vietnam, Indonesia and Saudi Arabia, in addition to China.4. https://single-market-economy.ec.europa.eu/sectors/raw-materials/areas-specific-interest/critical-raw-materials/strategic-projects-under-crma_en5. IPEF was launched on May 23,2022 at Tokyo. 14 member countries are Australia, Brunei, Fiji, India, Indonesia, Japan, Republic of Korea, Malaysia, New Zealand, Philippines, Singapore, Thailand, Vietnam and the USA. 4 Pillar of IPEF are Trade (Pillar 1), Supply Chain (Pillar 2),Clean Economy (Pillar 3) and Fair Economy (Pillar 4).6. Critics say “lack of substantive actions and binding commitments, instead focusing on process-driven framework building.” https://www.piie.com/blogs/realtime-economics/its-time-ipef-countries-take-action-supply-chain-resilience7. https://ec.europa.eu/commission/presscorner/detail/en/ip_22_54438. As of 2023, the first-largest trade partner of Korea is China (Trade volume of $267.66bn), the second is the US ($186.96bn) and the third is Vietnam ($79.43bn)9. As preferential ROO contain the labour value content requirement in the USMCA, it could increase compliance costs for importers. https://crsreports.congress.gov/product/pdf/RL/RL3452410. USITC(1996), Country of Origin Marking: Review of Laws, Regulations and Practices, USITC Publication 2975, July, pp. 2–411. https://www.barrons.com/articles/hong-kong-financial-center-china-46ba5d3612. Porter identifies a value chain broken in five primary activities: inbound logistics, operations, outbound logistics, marketing and sales and post-sale services. https://www.usitc.gov/publications/332/journals/concepts_approaches_in_gvc_research_final_april_18.pdf13. MAU is a metric commonly used to identify the number of unique users who engage with apps and website. MAU is an important measurement to the level of platform competitiveness in the digital trade logistics or e-commerce industry.14. https://home.kpmg/xx/en/home/insights/2019/12/china-belt-and-road-initiative-and-the-global-chemical-industry.html15. https://www.bradley.com/insights/publications/2023/10/the-india-middle-east-europe-economic-corridor-prospects-and-challenges-for-us-businesses16. The Asian Development Bank (ADB), which first used the term in 1998, defines economic corridors as important networks or connections between economic agents along a defined geography, which link the supply and demand sides of markets. http://research.bworldonline.com/popular-economics/story.php?id=350&title=Economic-corridors-boost-markets,-living-conditions17. Legovini et al. (2020) comments traditional cross border agreements of transport investment focuses only on a narrow set of direct benefits and cost. However, economic corridors can entail much wider economic benefits and costs such as trade and economic activity, structural change, poverty reduction, pollution and deforestation.18. Arab Centre Washington D.C. https://arabcenterdc.org/resource/the-geopolitics-of-the-india-middle-east-europe-economic-corridor/ References Bayne, N. (2017), Challenge and Response in the New Economic Diplomacy, 4th ed., The New Economic Diplomacy, Routledge, London, p. 19.Blanchard, J.M.F. and Ripsman, N.M. (2008), “A political theory of economic statecraft”, Foreign Policy Analysis, Vol. 4, pp. 371-398, doi: 10.1111/j.1743-8594.2008.00076.x.Gereffi, G., Humphrey, J. and Sturgeon, T. (2005), “The governance of value chain”, Review of International Political Economy, Vol. 12 No. 1, pp. 78-104, doi: 10.1080/09692290500049805.Kraljic, P. (1983), “Purchasing must be supply management”, Harvard Business Review, Vol. 61 No. 5, September.Legovini, A., Duhaut, A. and Bougna, T. (2020), “Economic corridors-transforming the growth potential of transport investments”, p. 10.Octaviano, B.Y. and Trishia, P. (2014), Economic Corridors Boost Markets, Living Conditions, Business World Research, Islamabad, October.United States International Trade Commission (USITC) (1996), “Country of origin marking: Review of Laws, Regulations, and Practices”, USITC Publication, Vol. 2975, July, pp. 2-4.Further readingPorter, M. (1985), Competitive Advantage: Creating and Sustaining Superior Performance, Free Press.Putman, R.D. (1988), “Diplomacy and domestic politics; the logic of two-level games”, International Organization, Vol. 42 No. 4, pp. 427-600.USITC (2019), “Global value chain analysis: concepts and approaches”, Journal of International Commerce and Economics, April, pp. 1-29.

Energy & Economics
Commodity and alternative asset, gold bar and crypto currency Bitcoin on rising price graph as financial crisis or war safe haven, investment asset or wealth concept.

Assessing Bitcoin and Gold as Safe Havens Amid Global Uncertainties: A Rolling Window DCC-GARCH Analysis

by Anoop S Kumar , Meera Mohan , P. S. Niveditha

Abstract We examine the roles of Gold and Bitcoin as a hedge, a safe haven, and a diversifier against the coronavirus disease 2019 (COVID-19) pandemic and the Ukraine War. Using a rolling window estimation of the dynamic conditional correlation (DCC)-based regression, we present a novel approach to examine the time-varying safe haven, hedge, and diversifier properties of Gold and Bitcoin for equities portfolios. This article uses daily returns of Gold, Bitcoin, S&P500, CAC 40, and NSE 50 from January 3, 2018, to October 15, 2022. Our results show that Gold is a better safe haven than the two, while Bitcoin exhibits weak properties as safe haven. Bitcoin can, however, be used as a diversifier and hedge. This study offers policy suggestions to investors to diversify their holdings during uncertain times. Introduction Financial markets and the diversity of financial products have risen in both volume and value, creating financial risk and establishing the demand for a safe haven for investors. The global financial markets have faced several blows in recent years. From the Global Financial Crisis (GFC) to the outbreak of the pandemic and uncertainty regarding economic policy measures of governments and central banks, the financial markets including equity markets around the world were faced with severe meltdowns. This similar behavior was observed in other markets including equity and commodity markets, resulting in overall uncertainty. In this scenario, the investors normally flock toward the safe-haven assets to protect their investment. In normal situations, investors seek to diversify or hedge their assets to protect their portfolios. However, the financial markets are negatively impacted when there are global uncertainties. Diversification and hedging methods fail to safeguard investors’ portfolios during instability because almost all sectors and assets are negatively affected (Hasan et al., 2021). As a result, investors typically look for safe-haven investments to safeguard their portfolios under extreme conditions (Ceylan, 2022). Baur and Lucey (2010) provide the following definitions of hedge, diversifier, and safe haven: Hedge: An asset that, on average, has no correlation or a negative correlation with another asset or portfolio. On average, a strict hedge has a (strictly) negative correlation with another asset or portfolio.Diversifier: An asset that, on average, has a positive correlation (but not perfect correlation) with another asset or portfolio. Safe haven: This is the asset that in times of market stress or volatility becomes uncorrelated or negatively associated with other assets or a portfolio. As was previously indicated, the significant market turbulence caused by a sharp decline in consumer spending, coupled with insufficient hedging opportunities, was a common feature of all markets during these times (Yousaf et al., 2022). Nakamoto (2008) suggested a remedy by introducing Bitcoin, a “digital currency,” as an alternative to traditional fiduciary currencies (Paule-Vianez et al., 2020). Bitcoin often described as “Digital Gold” has shown greater resilience during periods of crises and has highlighted the potential safe haven and hedging property against uncertainties (Mokni, 2021). According to Dyhrberg (2016), the GFC has eased the emergence of Bitcoin thereby strengthening its popularity. Bouri et al. (2017) in their study indicate that Bitcoin has been viewed as a shelter from global uncertainties caused by conventional banking and economic systems. Recent research has found that Bitcoin is a weak safe haven, particularly in periods of market uncertainty like the coronavirus disease 2019 (COVID-19) crisis (Conlon & McGee, 2020; Nagy & Benedek, 2021; Shahzad et al., 2019; Syuhada et al., 2022). In contrast to these findings, a study by Yan et al. (2022) indicates that it can function as a strong safe haven in favorable economic times and with low-risk aversion. Ustaoglu (2022) also supports the strong safe-haven characteristic of Bitcoin against most emerging stock market indices during the COVID-19 period. Umar et al. (2023) assert that Bitcoin and Gold are not reliable safe-havens. Singh et al. (2024) in their study reveal that Bitcoin is an effective hedge for investments in Nifty-50, Sensex, GBP–INR, and JPY–INR, at the same time a good diversifier for Gold. The study suggests that investors can incorporate Bitcoin in their portfolios as a good hedge against market volatility in equities and commodities markets. During the COVID-19 epidemic, Barbu et al. (2022) investigated if Ethereum and Bitcoin could serve as a short-term safe haven or diversifier against stock indices and bonds. The outcomes are consistent with the research conducted by Snene Manzli et al. (2024). Both act as hybrid roles for stock market returns, diversifiers for sustainable stock market indices, and safe havens for bond markets. Notably, Bhuiyan et al. (2023) found that Bitcoin provides relatively better diversification opportunities than Gold during times of crisis. To reduce risks, Bitcoin has demonstrated a strong potential to operate as a buffer against global uncertainty and may be a useful hedging tool in addition to Gold and similar assets (Baur & Lucey, 2010; Bouri et al., 2017; Capie et al., 2005; Dyhrberg, 2015). According to Huang et al. (2021), its independence from monetary policies and minimal association with conventional financial assets allow it to have a safe-haven quality. Bitcoins have a substantial speed advantage over other assets since they are traded at high and constant frequencies with no days when trading is closed (Selmi et al., 2018). Additionally, it has been demonstrated that the average monthly volatility of Bitcoin is higher than that of Gold or a group of international currencies expressed in US dollars; nevertheless, the lowest monthly volatility of Bitcoin is lower than the maximum monthly volatility of Gold and other foreign currencies (Dwyer, 2015). Leverage effects are also evident in Bitcoin returns, which show lower volatilities in high return periods and higher volatilities in low return times (Bouri et al., 2017; Liu et al., 2017). According to recent research, Bitcoins can be used to hedge S&P 500 stocks, which increases the likelihood that institutional and retail investors will build secure portfolios (Okorie, 2020). Bitcoin demonstrates strong hedging capabilities and can complement Gold in minimizing specific market risks (Baur & Lucey, 2010). Its high-frequency and continuous trading further enrich the range of available hedging tools (Dyhrberg, 2016). Moreover, Bitcoin spot and futures markets exhibit similarities to traditional financial markets. In the post-COVID-19 period, Zhang et al. (2021) found that Bitcoin futures outperform Gold futures.Gold, silver, palladium, and platinum were among the most common precious metals utilized as safe-haven investments. Gold is one such asset that is used extensively (Salisu et al., 2021). Their study tested the safe-haven property of Gold against the downside risk of portfolios during the pandemic. Empirical results have also shown that Gold functions as a safe haven for only 15 trading days, meaning that holding Gold for longer than this period would result in losses to investors. This explains why investors buy Gold on days of negative returns and sell it when market prospects turn positive and volatility decreases (Baur & Lucey, 2010). In their study, Kumar et al. (2023) tried to analyse the trends in volume throughout futures contracts and investigate the connection between open interest, volume, and price for bullion and base metal futures in India. Liu et al. (2016) in their study found that there is no negative association between Gold and the US stock market during times of extremely low or high volatility. Because of this, it is not a strong safe haven for the US stock market (Hood & Malik, 2013). Post-COVID-19, studies have provided mixed evidence on the safe-haven properties of Gold (Bouri et al., 2020; Cheema et al., 2022; Ji et al., 2020). According to Kumar and Padakandla (2022), Gold continuously demonstrates safe-haven qualities for all markets, except the NSE, both in the short and long term. During the COVID-19 episode, Gold’s effectiveness as a hedge and safe-haven instrument has been impacted (Akhtaruzzaman et al., 2021). Al-Nassar (2024) conducted a study on the hedge effectiveness of Gold and found that it is a strong hedge in the long run. Bhattacharjee et al. (2023) in their paper examined the symmetrical and asymmetrical linkage between Gold price levels and the Indian stock market returns by employing linear autoregressive distributed lag and nonlinear autoregressive distributed lag models. The results exhibit that the Indian stock market returns and Gold prices are cointegrated. According to the most recent study by Kaczmarek et al. (2022), Gold has no potential as a safe haven, despite some studies on the COVID-19 pandemic showing contradictory results. The co-movements of Bitcoin and the Chinese stock market have also normalized as a result of this epidemic (Belhassine & Karamti, 2021). Widjaja and Havidz (2023) verified that Gold was a safe haven asset during the COVID-19 pandemic, confirming the Gold’s safe-haven characteristic. As previously pointed out, investors value safe-haven investments in times of risk. Investors panic at these times when asset prices fall and move from less liquid (risky) securities to more liquid (safe) ones, such as cash, Gold, and government bonds. An asset must be bought and sold rapidly, at a known price, and for a reasonably modest cost to be considered truly safe (Smales, 2019). Therefore, we need to properly re-examine the safe-haven qualities of Gold and Bitcoin due to the mixed evidences regarding their safe-haven qualities and the impact of COVID-19 and the war in Ukraine on financial markets. This work contributes to and deviates from the body of existing literature in the following ways. We propose a novel approach in this work to evaluate an asset’s time-varying safe haven, hedge, and diversifier characteristics. This research examines the safe haven, hedging, and diversifying qualities of Gold and Bitcoin against the equity indices; S&P 500, CAC 40, and NSE 50. Through the use of rolling window estimation, we extend the methodology of Ratner and Chiu (2013) by estimating the aforementioned properties of the assets. Comparing rolling window estimation to other conventional techniques, the former will provide a more accurate representation of an asset’s time-varying feature. This study explores the conventional asset Gold’s time-varying safe haven, hedging, and diversifying qualities during crises like the COVID-19 pandemic and the conflict in Ukraine. We use Bitcoin, an unconventional safe-haven asset, for comparison. Data and Methodology We use the daily returns of three major equity indices; S&P500, CAC 40, and NSE 50 from January 3, 2018, to October 15, 2022. The equity indices were selected to represent three large and diverse markets namely the United States, France, and India in terms of geography and economic development. We assess safe-haven assets using the daily returns of Gold and Bitcoin over the same time. Equity data was collected from Yahoo Finance, Bitcoin data from coinmarketcap.com, and Gold data from the World Gold Council website. Engle (2002) developed the DCC (Dynamic Conditional Correlation)-GARCH model, which is frequently used to assess contagion amid pandemic uncertainty or crises. Time-varying variations in the conditional correlation of asset pairings can be captured using the DCC-GARCH model. Through employing this model, we can analyse the dynamic behavior of volatility spillovers. Engle’s (2002) DCC-GARCH model contains two phases; 1. Univariate GARCH model estimation2. Estimation of time-varying conditional correlation. For its explanation, mathematical characteristics, and theoretical development, see here [insert the next link in “the word here” https://journals.sagepub.com/doi/10.1177/09711023251322578] Results and Discussion The outcomes of the parameters under the DCC-GARCH model for each of the asset pairs selected for the investigation are shown in Table 1.   First, we look at the dynamical conditional correlation coefficient, ρ.The rho value is negative and insignificant for NSE 50/Gold, NSE 50 /BTC, S&P500/Gold, and S&P500/BTC indicating a negative and insignificant correlation between these asset pairs, showing Gold and Bitcoin as potential hedges and safe havens. The fact that ρ is negative and significant for CAC 40/Gold suggests that Gold can be a safe haven against CAC 40 swings. The asset pair CAC/BTC, on the other hand, has possible diversifier behavior with ρ being positive but statistically insignificant. Next, we examine the behavior of the DCC-GARCH parameters; α and β. We find that αDCC is statistically insignificant for all the asset pairs, while βDCC is statistically significant for all asset pairs. βDCC quantifies the persistence feature of the correlation and the extent of the impact of volatility spillover in a particular market’s volatility dynamics. A higher βDCC value implies that a major part of the volatility dynamics can be explained by the respective market’s own past volatility. For instance, the NSE 50/Gold’s βDCC value of 0.971 shows that there is a high degree of volatility spillover between these two assets, with about 97% of market volatility being explained by the assets’ own historical values and the remainder coming from spillover. Thus, we see that the volatility spillover is highly persistent (~0.8) for all the asset pairs except NSE 50/BTC. The results above show that the nature of the dynamic correlation between the stock markets, Bitcoin and Gold is largely negative, pointing toward the possibility of Gold and Bitcoin being hedge/safe haven. However, a detailed analysis is needed to confirm the same by employing rolling window analysis, and we present the results in the forthcoming section. We present the rolling window results for S&P500 first. We present the regression results for Gold in Figure 1 and Bitcoin in Figure 2   Figure 1. Rolling Window Regression Results for S&P500 and Gold.Note: Areas shaded under factor 1 represent significant regression coefficients. In Figure 1, we examine the behavior of β0 (intercept term), β1, β2, and β3 (partial correlation coefficients). The intercept term β0 will give an idea about whether the asset is behaving as a diversifier or hedge. Here, the intercept term shows significance most of the time. However, during 2018, the intercept was negative and significant, showing that it could serve as a hedge during geopolitical tensions and volatilities in the global stock market. However, during the early stages of COVID-19, we show that the intercept is negative and showing statistical significance, suggesting that Gold could serve as a hedge during the initial shocks of the pandemic. These findings are contrary to the results in the study by Tarchella et al. (2024) where they found hold as a good diversifier. Later, we find the intercept to be positive and significant, indicating that Gold could act as a potential diversifier. But during the Russia-Ukraine War, Gold exhibited hedge ability again. Looking into the behavior of β1, which is the partial correlation coefficient for the tenth percentile of return distribution shows negative and insignificant during 2018. Later, it was again negative and significant during the initial phases of COVID-19, and then negative in the aftermath, indicating that Gold could act as a weak safe haven during the COVID-19 pandemic. Gold could serve as a strong safe haven for the SP500 against volatility in the markets brought on by the war in Ukraine, as we see the coefficient to be negative and large during this time. From β2 and β3, the partial correlation coefficients of the fifth and first percentile, respectively, show that Gold possesses weak safe haven properties during COVID-19 and strong safe haven behavior during the Ukraine crisis. Next, we examine the characteristics of Bitcoin as a hedge/diversifier/safe haven against the S&P500 returns. We present the results in Figure 2.   Figure 2. Rolling Window Regression Results for S&P500 and Bitcoin.Note: Areas shaded under factor 1 represent significant regression coefficients. Like in the previous case, we begin by analysing the behavior of the intercept coefficient, which is β0. As mentioned earlier the intercept term will give a clear picture of the asset’s hedging and diversifier property. In the period 2018–2019, the intercept term is positive but insignificant. This could be due to the large volatility in Bitcoin price movements during the period. It continues to be minimal (but positive) and insignificant during 2019–2020, indicating toward weak diversification possibility. Post-COVID-19 period, the coefficient shows the significance and positive value, displaying the diversification potential. We see that the coefficient remains positive throughout the analysis, confirming Bitcoin’s potential as a diversifier. Looking into the behavior of β1 (the partial correlation coefficient at tenth percentile), it is positive but insignificant during 2018. The coefficient is having negative sign and showing statistical significance in 2019, suggesting that Bitcoin could be a good safe haven in that year. This year was characterized by a long list of corporate scandals, uncertainties around Brexit, and tensions in global trade. We can observe that throughout the COVID-19 period, the coefficient is showing negative sign and negligible during the March 2020 market meltdown, suggesting inadequate safe-haven qualities. However, Bitcoin will regain its safe-haven property in the coming periods, as the coefficient is negative and significant in the coming months. The coefficient is negative and shows statistical significance during the Ukrainian crisis, suggesting strong safe-haven property. Only during the Ukrainian crisis could Bitcoin serve as a safe haven, according to the behavior of β2, which displays the partial correlation coefficient at the fifth percentile. Bitcoin was a weak safe haven during COVID-19 and the Ukrainian crisis, according to β3, the partial correlation coefficient for the first percentile (coefficient negative and insignificant). According to the overall findings, Gold is a stronger safe haven against the S&P 500’s swings. This result is consistent with the previous studies of Triki and Maatoug (2021), Shakil et al. (2018), Będowska-Sójka and Kliber (2021), Drake (2022), and Ghazali et al. (2020), etc. The same analysis was conducted for the CAC 40 and the NSE 50; the full analysis can be found here [insert the next link in “the word here” https://journals.sagepub.com/doi/10.1177/09711023251322578]. However, it is important to highlight the respective results: In general, we may say that Gold has weak safe-haven properties considering CAC40. We can conclude that Bitcoin’s safe-haven qualities for CAC40 are weak. We can say that Gold showed weak safe-haven characteristics during the Ukraine crisis and good safe-haven characteristics for the NSE50 during COVID-19. We may say that Bitcoin exhibits weak safe haven, but strong hedging abilities to NSE50. Concluding Remarks In this study, we suggested a new method to evaluate an asset’s time-varying hedge, diversifier, and safe-haven characteristics. We propose a rolling window estimation of the DCC-based regression of Ratner and Chiu (2013). Based on this, we estimate the conventional asset’s time-varying safe haven, hedging, and diversifying properties during crises like the COVID-19 pandemic and the conflict in Ukraine. For comparison purposes, we include Bitcoin, a nonconventional safe-haven asset. We evaluate Gold and Bitcoin’s safe haven, hedging, and diversifier properties to the S&P 500, CAC 40, and NSE 50 variations. We use a rolling window of length 60 to estimate the regression. From the results, we find that Gold can be considered as a better safe haven against the fluctuations of the S&P 500. In the case of CAC 40, Gold and Bitcoin have weak safe-haven properties. While Bitcoin demonstrated strong safe-haven characteristics during the Ukraine crisis, Gold exhibited strong safe-haven characteristics during COVID-19 for the NSE 50. Overall, the findings indicate that Gold is the better safe haven. This outcome is consistent with earlier research (Będowska-Sójka & Kliber, 2021; Drake, 2022; Ghazali et al., 2020; Shakil et al., 2018; Triki & Maatoug, 2021). When it comes to Bitcoin, its safe-haven feature is weak. Bitcoin, however, works well as a diversifier and hedge. Therefore, from a policy perspective, investing in safe-haven instruments is crucial to lower the risks associated with asset ownership. Policymakers aiming to enhance the stability of financial portfolios might encourage institutional investors and other market players to incorporate Gold into their asset allocations. Gold’s strong safe-haven qualities, proven across various market conditions, make it a reliable choice. Gold’s performance during crises like COVID-19 highlights its potential to mitigate systemic risks effectively. Further, Bitcoin could also play a complementary role as a hedge and diversifier, especially during periods of significant volatility such as the Ukraine crisis. While Bitcoin’s safe-haven characteristics are relatively weaker, its inclusion in a diversified portfolio offers notable value and hence it should not be overlooked. Further, policymakers may consider how crucial it is to monitor dynamic correlations and periodically rebalance portfolios to account for shifts in the safe haven and hedging characteristics of certain assets. Such measures could help reduce the risks of over-reliance on a single asset type and create more resilient portfolios that can better withstand global economic shocks. For future research, studies can be conducted on the estimation of the rolling window with different widths. This is important to understand how the safe-haven property changes across different holding periods. Further, more equity markets would be included to account for the differences in market capitalization and index constituents. This study can be extended by testing these properties for multi-asset portfolios as well. We intend to take up this study in these directions in the future. Data Availability StatementNot applicable.Declaration of Conflicting InterestsThe authors declared no potential conflicts of interest with respect to the research, authorship, and/or publication of this article.FundingThe authors received no financial support for the research, authorship, and/or publication of this article.ReferencesAkhtaruzzaman M., Boubaker S., Lucey B. M., & Sensoy A. (2021). Is gold a hedge or a safe-haven asset in the COVID-19 crisis? Economic Modelling, 102, 105588. Crossref. Web of Science.Al-Nassar N. S. (2024). Can gold hedge against inflation in the UAE? A nonlinear ARDL analysis in the presence of structural breaks. PSU Research Review, 8(1), 151–166. Crossref.Barbu T. C., Boitan I. A., & Cepoi C. O. (2022). Are cryptocurrencies safe havens during the COVID-19 pandemic? A threshold regression perspective with pandemic-related benchmarks. Economics and Business Review, 8(2), 29–49. Crossref.Baur D. G., & Lucey B. M. (2010). Is gold a hedge or a safe haven? An analysis of stocks, bonds and gold. Financial Review, 45(2), 217–229. Crossref.Będowska-Sójka B., & Kliber A. (2021). Is there one safe-haven for various turbulences? The evidence from gold, Bitcoin and Ether. The North American Journal of Economics and Finance, Elsevier, 56, 101390. Crossref.Belhassine O., & Karamti C. (2021). Contagion and portfolio management in times of COVID-19. Economic Analysis and Policy, 72, 73–86. Crossref. PubMed. Web of Science.Bhattacharjee A., Das J., & Kumar S. (2023). Evaluating the symmetrical and asymmetrical linkage between gold price and Indian stock market in the presence of structural change. NMIMS Management Review, 31(4), 288–297. Crossref. Web of Science.Bhuiyan R. A., Husain A., & Zhang C. (2023). Diversification evidence of Bitcoin and Gold from wavelet analysis. Financial Innovation, 9(1), 100. Crossref. PubMed. Web of Science.Bouri E., Azzi G., & Dyhrberg A. H. (2017). On the return-volatility relationship in the Bitcoin market around the price crash of 2013. Economics, 11(1), 2. Crossref.Bouri E., Gupta R., Tiwari A. K., & Roubaud D. (2017). Does Bitcoin hedge global uncertainty? Evidence from wavelet-based quantile-in-quantile regressions. Finance Research Letters, 23, 87–95. Crossref. Web of Science.Bouri E., Shahzad S. J. H., Roubaud D., Kristoufek L., & Lucey B. (2020). Bitcoin, gold, and commodities as safe havens for stocks: New insight through wavelet analysis. The Quarterly Review of Economics and Finance, 77, 156–164. Crossref. Web of Science.Brenner M., & Galai D. (1989). New financial instruments for hedge changes in volatility. Financial Analysts Journal, 45(4), 61–65. Crossref.Capie F., Mills T. C., & Wood G. (2005). Gold as a hedge against the dollar. Journal of International Financial Markets, Institutions and Money, 15(4), 343–352. Crossref.Ceylan Ö. (2022). Hedging Effectiveness of the VIX ETPs: An analysis of the time-varying performance of the VXX. In Handbook of research on new challenges and global outlooks in financial risk management (pp. 384–401). IGI Global. Crossref.Cheema M. A., Faff R., & Szulczyk K. R. (2022). The 2008 global financial crisis and COVID-19 pandemic: How safe are the safe haven assets? International Review of Financial Analysis, 83, 102316. Crossref. PubMed. Web of Science.Conlon T., & McGee R. (2020). Safe haven or risky hazard? Bitcoin during the COVID-19 bear market. Finance Research Letters, 35, 101607. Crossref. PubMed. Web of Science.Demir E., Gozgor G., Lau C. K. M., & Vigne S. A. (2018). Does economic policy uncertainty predict the Bitcoin returns? An empirical investigation. Finance Research Letters, 26, 145–149. Crossref. Web of Science.Drake P. P. (2022). The gold-stock market relationship during COVID-19. Finance Research Letters, 44, 102111. Crossref. PubMed. Web of Science.Dwyer G. P. (2015). The economics of Bitcoin and similar private digital currencies. Journal of Financial Stability, 17, 81–91. Crossref. Web of Science.Dyhrberg A. H. (2015). Hedging capabilities of bitcoin. Is it the virtual gold? Finance Research Letters, 1–6. https://doi.org/10.1016/j.frl.2015.10.025Dyhrberg A. H. (2016). Hedging capabilities of bitcoin. Is it the virtual gold? Finance Research Letters, 16, 139–144. https://doi.org/10.1016/j.frl.2015.10.025 Web of Science.Engle R. (2002). Dynamic conditional correlation: A simple class of multivariate generalized autoregressive conditional heteroskedasticity models. Journal of Business & Economic Statistics, 20(3), 339–350. Crossref. Web of Science.Ghazali M. F., Lean H. H., & Bahari Z. (2020). Does gold investment offer protection against stock market losses? Evidence from five countries. The Singapore Economic Review, 65(02), 275–301. Crossref.Hasan M. B., Hassan M. K., Rashid M. M., & Alhenawi Y. (2021). Are safe haven assets really safe during the 2008 global financial crisis and COVID-19 pandemic? Global Finance Journal, 50, 100668. Crossref. PubMed.Hood M., & Malik F. (2013). Is gold the best hedge and a safe haven under changing stock market volatility? Review of Financial Economics, 22(2), 47–52. Crossref.Huang Y., Duan K., & Mishra T. (2021). Is Bitcoin really more than a diversifier? A pre-and post-COVID-19 analysis. Finance Research Letters, 43, 102016. Crossref.Ji Q., Zhang D., & Zhao Y. (2020). Searching for safe-haven assets during the COVID-19 pandemic. International Review of Financial Analysis, 71, 101526. Crossref. PubMed. Web of Science.Kaczmarek T., Będowska-Sójka B., Grobelny P., & Perez K. (2022). False safe haven assets: Evidence from the target volatility strategy based on recurrent neural network. Research in International Business and Finance, 60, 101610. Crossref. Web of Science.Kumar A. S., & Padakandla S. R. (2022). Testing the safe-haven properties of gold and bitcoin in the backdrop of COVID-19: A wavelet quantile correlation approach. Finance Research Letters, 47, 102707. Crossref. PubMed. Web of Science.Kumar M. A., Swathi J., Pallavi T. A., & Bavana S. (2023). Volume progression and price–volume relationship of commodity futures: Case of bullion and base metals. NMIMS Management Review, 31(4), 265–274. https://doi.org/10.1177/09711023241230463 Web of Science.Liu C. S., Chang M. S., Wu X., & Chui C. M. (2016). Hedges or safe havens—Revisit the role of gold and USD against stock: A multivariate extended skew-t copula approach. Quantitative Finance, 16(11), 1763–1789. Crossref.Liu R., Zhichao S., Wei G., & Wang W. (2017). GARCH model with fat-tailed distributions and Bitcoin exchange rate returns. Journal of Accounting, Business and Finance Research, 1(1), 71–75. https://doi.org/10.2139/ssrn.3666106 Crossref.Mokni K. (2021). When, where, and how economic policy uncertainty predicts Bitcoin returns and volatility? A quantiles-based analysis. The Quarterly Review of Economics and Finance, 80, 65–73. Crossref.Nagy B. Z., & Benedek B. (2021). Higher co-moments and adjusted Sharpe ratios for cryptocurrencies. Finance Research Letters, 39, 101543. Crossref. Web of Science.Nakamoto S. (2008). Bitcoin: A peer-to-peer electronic cash system. Bitcoin. https://bitcoin.org/bitcoin.pdfOkorie D. I. (2020). Could stock hedge Bitcoin risk(s) and vice versa? Digital Finance, 2(1), 117–136. Crossref.Paule-Vianez J., Prado-Román C., & Gómez-Martínez R. (2020). Economic policy uncertainty and Bitcoin. Is Bitcoin a safe-haven asset? European Journal of Management and Business Economics, 29(3), 347–363. Crossref.Ratner M., & Chiu C. C. J. (2013). Hedging stock sector risk with credit default swaps. International Review of Financial Analysis, 30, 18–25. Crossref. Web of Science.Salisu A. A., Raheem I. D., & Vo X. V. (2021). Assessing the safe haven property of the gold market during COVID-19 pandemic. International Review of Financial Analysis, 74, 101666. Crossref. PubMed. Web of Science.Saxena S., & Villar A. (2008). Hedging instruments in emerging market economies. Financial globalisation and emerging market capital flows. BIS Papers, 44, 71–87.Selmi R., Mensi W., Hammoudeh S., & Bouoiyour J. (2018). Is Bitcoin a hedge, a safe haven or a diversifier for oil price movements? A comparison with gold. Energy Economics, 74, 787–801. Crossref. Web of Science.Shahzad S. J. H., Bouri E., Roubaud D., Kristoufek L., & Lucey B. (2019). Is Bitcoin a better safe-haven investment than gold and commodities? International Review of Financial Analysis, 63, 322–330. Crossref. Web of Science.Shakil M. H., Mustapha I. H. M., Tasnia M., & Saiti B. (2018). Is gold a hedge or a safe haven? An application of ARDL approach. Journal of Economics, Finance and Administrative Science, 23(44), 60–76. Crossref.Singh V. V., Singh H., & Ansari A. (2024). Bitcoin as a distinct asset class for hedging and portfolio diversification: A DCC-GARCH model analysis. NMIMS Management Review, 32(1), 7–13. Crossref. Web of Science.Smales L. A. (2019). Bitcoin as a safe haven: Is it even worth considering? Finance Research Letters, 30, 385–393. Crossref. Web of Science.Snene Manzli Y., Alnafisah H., & Jeribi A. (2024). Safe haven ability of energy and agricultural commodities against G7 stock markets and banking indices during COVID-19, Russia–Ukraine War, and SVB collapse: Evidence from the wavelet coherence approach. Discrete Dynamics in Nature and Society, 2024(1), 2587000. Crossref.Syuhada K., Suprijanto D., & Hakim A. (2022). Comparing gold’s and Bitcoin’s safe-haven roles against energy commodities during the COVID-19 outbreak: A vine copula approach. Finance Research Letters, 46, 102471. Crossref. PubMed. Web of Science.Tarchella S., Khalfaoui R., & Hammoudeh S. (2024). The safe haven, hedging, and diversification properties of oil, gold, and cryptocurrency for the G7 equity markets: Evidence from the pre-and post-COVID-19 periods. Research in International Business and Finance, 67, 102125. Crossref. Web of Science.Triki M. B., & Maatoug A. B. (2021). The GOLD market as a safe haven against the stock market uncertainty: Evidence from geopolitical risk. Resources Policy, 70, 101872. Crossref. Web of Science.Umar Z., Bossman A., Choi S. Y., & Teplova T. (2023). The relationship between global risk aversion and returns from safe-haven assets. Finance Research Letters, 51, 103444. Crossref. Web of Science.Ustaoglu E. (2022). Safe-haven properties and portfolio applications of cryptocurrencies: Evidence from the emerging markets. Finance Research Letters, 47, 102716. Crossref. Web of Science.Widjaja M., & Havidz S. A. H. (2023). Are gold and cryptocurrency a safe haven for stocks and bonds? Conventional vs Islamic markets during the COVID-19 pandemic. European Journal of Management and Business Economics (ahead-of-print).Yan Y., Lei Y., & Wang Y. (2022). Bitcoin is a safe-haven asset and a medium of exchange. Axioms, 11(8), 415. Crossref.Yousaf I., Plakandaras V., Bouri E., & Gupta R. (2022). Hedge and safe haven properties of gold, US Treasury, Bitcoin, and Dollar/CHF against the FAANA companies and S&P 500 (Department of Economics, Working Paper Series No. 2022–27). University of Pretoria.Zhang Y., Zhu P., & Xu Y. (2021). Has COVID-19 changed the hedge effectiveness of bitcoin? Frontiers in Public Health, 9. https://doi.org/10.3389/fpubh.2021.704900
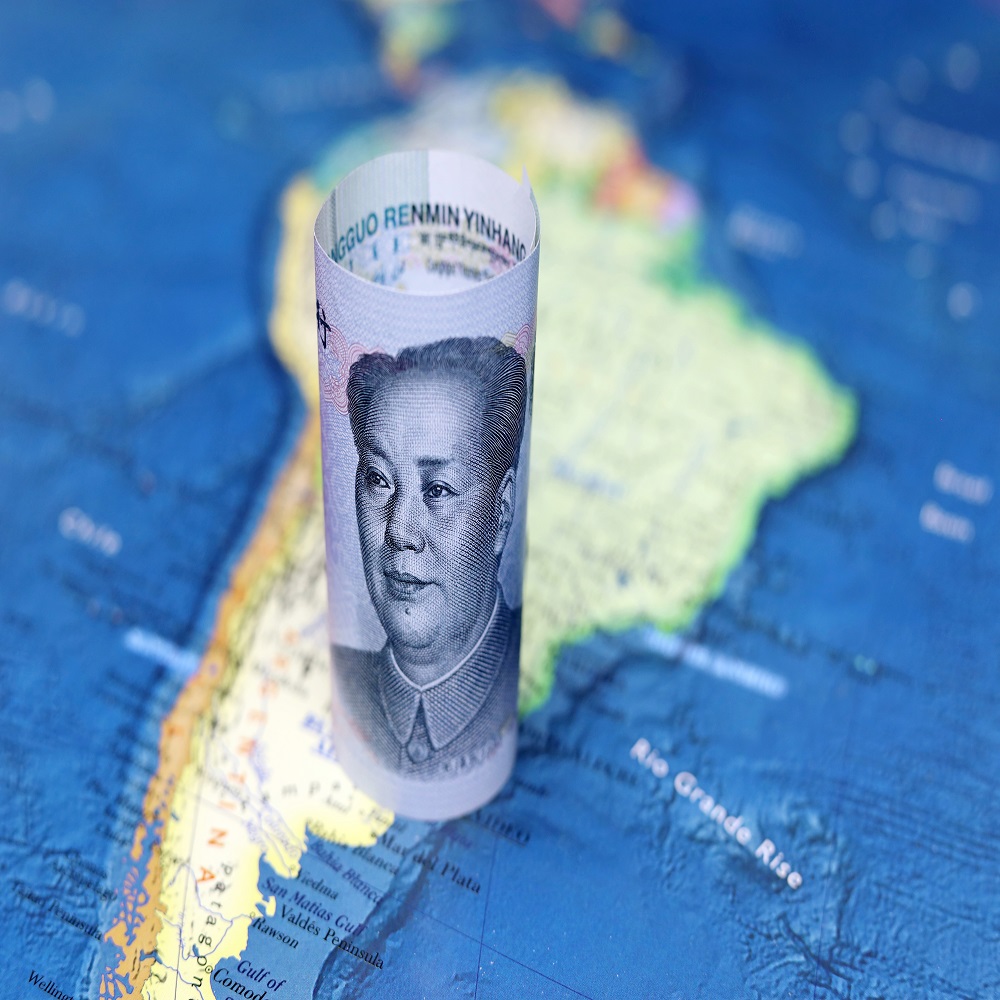
Energy & Economics
Global business connection concept. Double exposure world map on capital financial city and trading graph background. Elements of this image furnished by NASA

Liaison countries as foreign trade bridge builders in the geo-economic turnaround

by Eva Willer

Introduction Geopolitical tensions are making global trade increasingly difficult. In order to reduce the associated risk of default, companies are shifting their trade relations to trading partners that are politically similar to them. In the course of the beginnings of geo-economic fragmentation, politically and economically like-minded countries are also gaining in importance for German and European decision-makers. Liaison countries1 in particular can form a counterforce to the trend towards polarization in foreign trade - especially between the USA and China: they are characterized by a pronounced economic and trade policy openness that overrides differences between geopolitical or ideological camps. Consequently, the question arises: How can relevant connecting countries for Germany and Europe be identified? What opportunities and risks do closer trade relations with these countries offer in order to strengthen foreign trade resilience in geopolitically uncertain times?  With a high degree of openness - defined as the sum of imports and exports in relation to gross domestic product - of over 80 percent2 , the German economy is strongly integrated into global trade. Accordingly, the disruptive effect of geo-economic fragmentation on the German economy would be above average. The defensive strategy to strengthen Germany's economic security by pushing for trade policy independence would only reinforce geo-economic fragmentation. Against the backdrop of comparatively high economic vulnerability, it is necessary to focus on those potential partner countries with which German and European foreign trade could be developed and expanded even under the condition of increasing fragmentation.  Geoeconomic Fragmentation  The term "geo-economic fragmentation" is used to describe the politically motivated reorganization of global goods and financial flows, in which strategic, economic and political interests primarily determine the choice of countries of origin and destination for trade flows.3 In the scenario of geo-economic fragmentation, the result would be the formation of a bloc within the global community of states, which would fundamentally change the regulatory structure of global economic networking. In this case, trade and investment would probably concentrate from a previously diverse range of economic partner countries - prior to the formation of the bloc - on those countries that now - since the formation of the bloc - belong to the same bloc.  The likelihood of this scenario occurring and leading to an increased fragmentation of the global economic order has increased again in the recent past. For example, Donald Trump's second term as US president is causing increasing geopolitical uncertainty worldwide.  Statements on the concrete form of a possible demarcation of potential blocs are subject to a great deal of uncertainty. However, the division of a large part of the global economy into a "US bloc" and a "China bloc" is a conceivable scenario for which German politics and business should prepare.  Data already shows that, at a global level, foreign trade openness has decreased in the recent past. Data from the World Trade Organization (WTO) illustrates the increasing hurdles in global trade in goods. While 3.1% of global imports were still affected by tariff or non-tariff barriers to trade in 2016 - including under WTO rules - this figure rose to 11.8% in 2024 over the following years.4 This development goes hand in hand with a noticeable loss of importance and enforcement of the WTO since the 2010s, which previously played a central role as the guardian of the rules-based global economic order.  Studies by the International Monetary Fund (IMF) have already found indications of an incipient geo-economic fragmentation along potential bloc borders. It shows that trade in goods and foreign direct investment between countries that would belong to the opposing camp in the event of a bloc formation declined on average in 2022 and 2023 - in contrast to foreign trade between countries that are geopolitically close.5  In this initial phase of geo-economic fragmentation, liaison countries are beginning to establish themselves as a counterforce, holding the fragmenting global community of states together with new trade and investment routes.  Identification of liaison countries Specifically, liaison countries have the following characteristics: a pronounced openness to foreign trade in the form of a high foreign trade quota and low tariff and non-tariff trade barriers, as well as pronounced economic relations with partner countries from different geopolitical camps. The geopolitical orientation of countries can be examined using data on voting behavior within the United Nations.6 This involves analyzing whether a country can be assigned to the US or Chinese camp - or whether there is no pronounced proximity and therefore political neutrality or "non-alignment" in the sense of ideological independence. The data-based identification of connecting countries is relatively new. Empirical analyses are also limited to connecting countries in the context of US-Chinese foreign trade - specifically US imports from China. In this case, the characteristics of a connecting country can be broken down into (1) "non-alignment" - i.e. a geopolitical distance to both a Western and an Eastern bloc - as well as (2) an increase in imports and foreign investment from China and (3) a simultaneous increase in exports to the United States. In a narrower sense, this is an evasive reaction to trade restrictions, i.e. circumventing trade. If the foreign trade indicators - specifically the trade and investment data relating to the US and China - of "non-aligned" countries for the period from 2017 to 2020 show corresponding characteristic-related changes compared to previous years, these can be identified as countries connecting the US and China.  The analysis of trade data shows that the value of direct exports from China to the USA fell during Donald Trump's first term in office. At the same time, both Chinese exports to some of the "non-aligned" countries and exports from these countries to the USA have increased significantly. These countries have presumably stepped in as a link on the export route from China to the US after the previously direct trade flow was interrupted by trade barriers and had to find a new route. Companies producing in China are therefore likely to have sought new, indirect ways to maintain access to the US sales market.  A certain statistical inaccuracy in the foreign trade data makes it difficult to draw a definitive conclusion in this context. It should be noted: No single commodity can be tracked across national borders in trade data collection. Whether the additional goods imported from China actually found their way to the United States can only be assumed approximately. However, if the trade flows are aggregated, a clearer picture emerges and the circumvention trade via selected connecting countries - including Vietnam and Mexico - becomes visible.  Data on foreign direct investment rounds off the analysis.7 "Non-aligned" countries in which an increase in Chinese investment can be seen between 2016 and 2020 in addition to trade flows can be identified as connecting countries. Here, too, available data suggests that the companies concerned either exported their goods to the United States via a stopover or even outsourced parts of their production destined for the US market to connecting countries. Five connecting countries between the US and China Based on the 2017-2020 study period, various connecting countries can be empirically identified that were used to indirectly maintain access to the US market. In terms of foreign trade volume, the economically most important connecting countries include Mexico, Vietnam, Poland, Morocco and Indonesia.8 All five countries are characterized by the fact that both their exports of goods to the US and their imports of goods from China increased significantly between 2017 and 2020. In addition, greenfield investments (foreign direct investment to set up a new production facility) have risen significantly compared to the period before 2017.  However, the five countries show different priorities in their development, which differentiate them in their role as connecting countries between the USA and China. In Vietnam, exports to the USA in particular have risen sharply. China has been the most important procurement market for Vietnamese companies for years. Poland, Mexico and Indonesia are characterized as connecting countries primarily by the significant increase in imports from China. Morocco, in turn, was able to attract more Chinese foreign investment in particular. Greenfield investments have almost tripled here since 2017. However, Poland - a rather surprising candidate for the role of liaison country, as it is intuitively assigned to the US-oriented bloc - is positioned fairly centrally between the US and China according to the analysis of voting behavior within the United Nations9. In addition, Poland qualifies primarily due to the sharp rise in greenfield investments from China, primarily in the expansion of domestic battery production.10  It cannot be concluded from the previous studies on the USA and China whether German companies are also circumventing trade barriers from the USA via the countries identified. As the trade policy conflicts between the US and China differ significantly from those between the EU and China, there has been a lack of comparable empirical data to analyze connecting countries in the EU context. Opportunities and challenges As the German economy is strongly oriented towards foreign trade and is closely networked with both the USA and China, German companies play a particularly exposed role in the area of tension between the USA and China. Increased economic exchange with potential connecting countries would offer German companies an opportunity to mitigate the expected shock of a geopolitical bloc. They could at least maintain international trade to a certain extent and thus secure some of the endangered sales and procurement markets. On the other hand, there are also costs associated with expanding foreign trade relations with potential connecting countries. The greater complexity also increases the risk in the value chains. Companies that position themselves wisely within this trade-off buy themselves valuable time in the event of a shock to reorganize themselves against the backdrop of changed foreign trade conditions.  From the perspective of foreign trade policy, it is also possible to examine the extent to which stronger foreign trade cooperation with (potential) connecting countries could have advantages. The trade-off between resilience and complexity must then be assessed at a macroeconomic level, beyond individual company interests. In order to make it easier for companies to connect to potential connecting countries and to create appropriate framework conditions, German and European policy can build on existing comprehensive strategies at national and European level. Both the China Strategy11 and the National Security Strategy12 focus foreign policy on connecting countries as part of a stronger economic and political risk diversification. There is also a similar framework at European level with the EU's Strategic Compass13 . Following on from this, the German government could create targeted incentives to open up new markets in liaison countries, which would diversify critical supply chains and reduce one-sided dependencies.  At the same time, connecting countries pose a challenge. These can be used to circumvent foreign trade measures such as sanctions if flows of goods can find alternative routes via connecting countries more easily than before.  In order to realize opportunities and overcome challenges, close cooperation between science, politics and companies is required. This first requires the identification of a selection of potential connecting countries through scientifically sound analysis. This creates the basis for the subsequent steps in which European and German policymakers work closely with companies to create attractive framework conditions for trade with potential connecting countries - for example through bilateral trade agreements.  Attractive foreign trade framework conditions can create the necessary incentive to actually expand trade relations with potential connecting countries. Companies need to weigh up individual cases and make forward-looking decisions: To what extent is there a risk of a loss of production triggered by geopolitical conflicts? And how much would the complexity of the value chain increase if more potential connecting countries were included? Ultimately, the actual choice of preferred sales and procurement markets lies with the individual companies. LicenseThis work is licensed under CC BY 4.0 References1. Verbindungsländer werden im Sinne von Connectors verstanden, vgl. Gita Gopinath/Pierre-Olivier Gourinchas/Andrea F Presbitero/Petia Topalova, Changing Global Linkages: A New Cold War?, Washington, D.C.: IMF, April 2024 (IMF Working Paper) <https://www.imf.org/en/Publications/WP/Issues/2024/04/05/Changing-Global-Linkages-A-New-ColdWar-547357/>. 2. Statistisches Bundesamt (Destatis), Außenwirtschaft. 2025, <https://www.destatis.de/DE/Themen/Wirtschaft/Globalisierungsindikatoren/aussenwirtschaft.html#246 078/>.  3. Shekahar Aiyar/Franziska Ohnsorge, Geoeconomic Fragmentation and ‚Connector’ Countries, Online verfügbar unter:  <https://mpra.ub.uni-muenchen.de/121726/1/MPRA_paper_121726.pdf>.4. WTO, WTO Trade Monitoring Report, Genf, November 2024, <https://www.wto.org/english/tratop_e/tpr_e/factsheet_dec24_e.pdf/>. 5. Gita Gopinath/Pierre-Olivier Gourinchas/Andrea F Presbitero/Petia Topalova, Changing Global Linkages: A New Cold War?, Washington, D.C.: IMF, April 2024 (IMF Working Paper) <https://www.imf.org/en/Publications/WP/Issues/2024/04/05/Changing-Global-Linkages-A-New-ColdWar-547357/>.  6. Michael A. Bailey/Anton Strezhnev/Erik Voeten, »Estimating Dynamic State Preferences from United Nations Voting Data«, Journal of Conflict Resolution, 61 (2017) 2, S. 430-456, <https://journals.sagepub.com/doi/10.1177/0022002715595700/>.7. Gita Gopinath/Pierre-Olivier Gourinchas/Andrea F Presbitero/Petia Topalova, Changing Global Linkages: A New Cold War?, Washington, D.C.: IMF, April 2024 (IMF Working Paper) <https://www.imf.org/en/Publications/WP/Issues/2024/04/05/Changing-Global-Linkages-A-New-ColdWar-547357/>. War-547357. 8. Enda Curran/Shawn Donnan/Maeva Cousin, »These Five Countries are Key Economic ‚Connectors‘ in a Fragmenting World«, in Bloomberg (online), 1.11.2023, <https://www.bloomberg.com/news/articles/2023-1102/vietnam-poland-mexico-morocco-benefit-from-us-china-tensions/>.9. Michael A. Bailey/Anton Strezhnev/Erik Voeten, »Estimating Dynamic State Preferences from United Nations Voting Data«, Journal of Conflict Resolution, 61 (2017) 2, S. 430-456, <https://journals.sagepub.com/doi/10.1177/0022002715595700/>.  10. Enda Curran/Shawn Donnan/Maeva Cousin, »These Five Countries are Key Economic ‚Connectors‘ in a Fragmenting World«, in Bloomberg (online), 1.11.2023, <https://www.bloomberg.com/news/articles/202311-02/vietnam-poland-mexico-morocco-benefit-from-us-china-tensions/>.11. Auswärtiges Amt, China‐Strategie der Bundesregierung, Berlin, Juli 2023, <https://www.auswaertigesamt.de/resource/blob/2608578/810fdade376b1467f20bdb697b2acd58/china-strategie-data.pdf/>.  12. Auswärtiges Amt, Integrierte Sicherheit für Deutschland: Nationale Sicherheitsstrategie, Berlin, Juni 2023, <https://www.bmvg.de/resource/blob/5636374/38287252c5442b786ac5d0036ebb237b/nationalesicherheitsstrategie-data.pdf/>.  13. Rat der Europäischen Union, Ein Strategischer Kompass für Sicherheit und Verteidigung, Brüssel, März 2022, <https://data.consilium.europa.eu/doc/document/ST-7371-2022-INIT/de/pdf/>.