International North-South Transport Corridor: Geopolitical Implications and the Future of European Trade
by Krzysztof Sliwinski
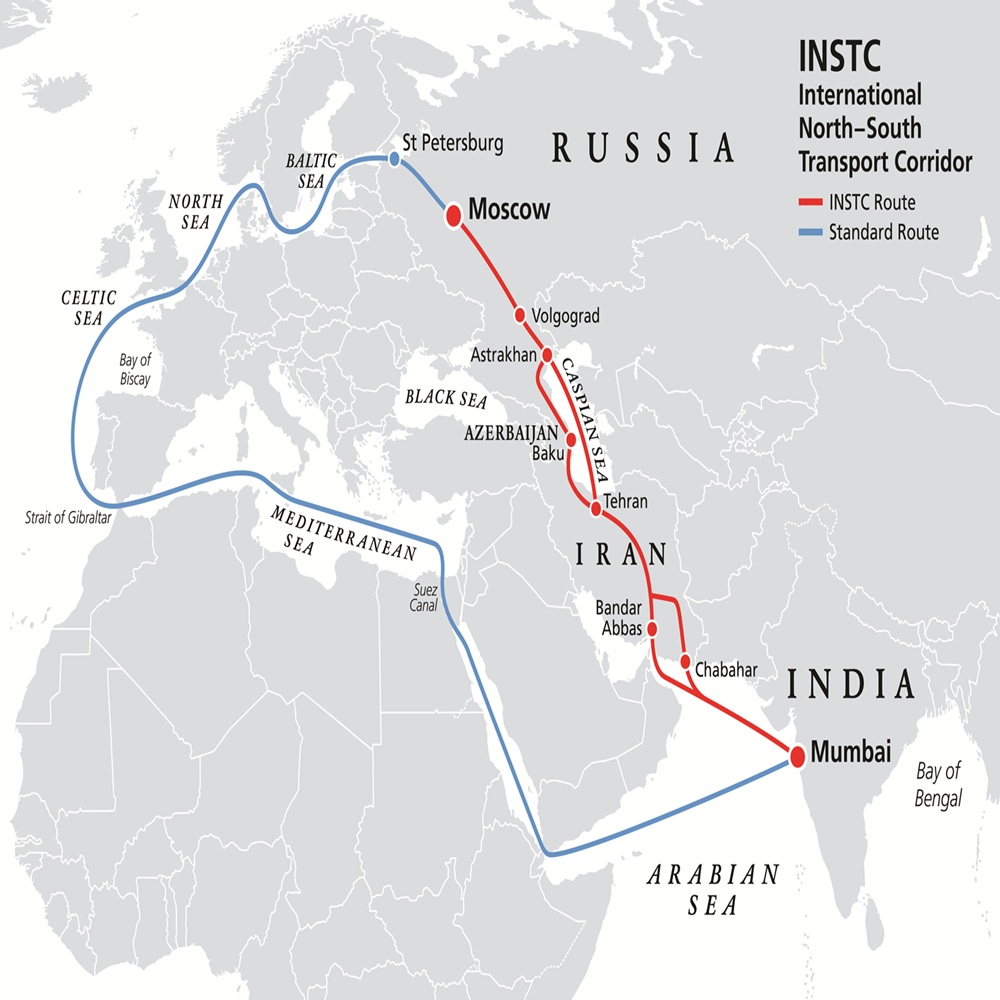
Abstract The International North–South Transport Corridor (INSTC) is a 7,200-kilometre multi-modal network connecting India, Iran, Azerbaijan, Russia, Central Asia, and Europe, offering a shorter and cost-effective alternative to the Suez Canal. Established in 2000 and expanding with key infrastructure projects like the Rasht-Astara railway, the corridor aims to boost trade volumes significantly by 2030, facilitating faster, cheaper freight movement and enhancing Eurasian integration. Russia and Iran’s collaboration is central, enabling a sanctions-resilient trade route that counters Western dominance and supports economic growth in transit countries. The INSTC also offers environmental benefits, with lower greenhouse gas emissions compared to deep-sea shipping. Strategically, it diversifies Russia’s transport links, reduces dependency on vulnerable Western routes, and strengthens geopolitical ties within the BRICS framework. However, challenges such as infrastructure gaps, sanctions, and regional conflicts persist. For the EU, INSTC presents both opportunities for cheaper trade and risks to its geopolitical influence, necessitating strategic responses to maintain Eurasian connectivity and sanctions effectiveness. Key Words: International Trade, North, South, Europe, geopolitics Introduction The International North–South Transport Corridor (INSTC) is a 7,200-kilometre multi-modal transportation network involving ships, railways, and roads designed to facilitate freight movement between India, Iran, Azerbaijan, Russia, Central Asia, and Europe.[1] Established in September 2000 under an agreement signed in St. Petersburg by India, Iran, and Russia, the corridor has since expanded to include additional members, including Belarus, Azerbaijan and several Central Asian countries. [2] Its primary aim is to enhance trade connectivity by linking major cities such as Mumbai, Tehran, Baku, and Moscow, and beyond, offering a shorter and more cost-effective alternative to traditional routes, including the Suez Canal. [3] Source: https://www.geopoliticalmonitor.com/geopolitics-of-the-international-north-south-transport-corridor-instc/ In 2025, container traffic along the eastern route (via Kazakhstan and Turkmenistan) nearly doubled, supported by discounts of 15 - 80% on shipments, which have been extended through 2026. [4] A milestone occurred in November 2025 when a cargo train from north of Moscow delivered 62 containers to Iran via Central Asia, highlighting the route's viability for India-Central Asia trade. [5] Overall, INSTC freight volumes reached 26.9 million tons in 2024 (19% up from prior years), with rail handling over 12.9 million tons, and projections aim for 15 million tons annually by 2027. [6] The INSTC operates through several interconnected paths. Western Route: from India via sea to Iran's Bandar Abbas port, then by road or rail northward through Iran to Azerbaijan, and onward to Russia. Central Route: involves transit across the Caspian Sea from Iranian ports like Bandar Anzali to Russian ports such as Astrakhan. Eastern Route: connects via Kazakhstan and Turkmenistan for land-based links to Russia. This setup allows for efficient cargo transit, with railways playing a crucial role, including ongoing projects like the Rasht-Astara railway in Iran, to fully connect the network. [7] Suez and its geopolitical importance The Suez Canal stands as one of the world's most strategically vital maritime chokepoints, connecting the Mediterranean Sea to the Red Sea and serving as a critical artery for global trade and energy security. Since its opening in 1869, the Suez Canal has fundamentally transformed global maritime trade patterns and geopolitical relationships. The canal provides the shortest maritime route between Europe and Asia, eliminating the need for the lengthy circumnavigation of Africa via the Cape of Good Hope. This strategic positioning has made the canal a focal point of international competition and a critical infrastructure asset whose security is of profound importance to the global economy. [8] The Suez Canal's economic importance cannot be overstated. The waterway attracts approximately 12 - 15% of worldwide trade and about 30% of global container traffic, with more than $1 trillion in goods transiting annually. An average of fifty to sixty ships transit the canal daily, carrying an estimated $3 billion to $9 billion in cargo value. [9] This concentration of trade flow makes the canal a critical node in global supply chains, particularly for trade between Asia and Europe.[10] The canal's strategic role extends beyond general cargo. It handles roughly 9% of global seaborne oil flows (approximately 9.2 million barrels per day) and around 8% of liquefied natural gas volumes. [11] his energy dimension amplifies the canal's geopolitical significance, as disruptions can directly impact global energy markets and prices. [12] The 2021 blockage of the Suez Canal by the Ever Given container ship demonstrated the canal's vulnerability, disrupting global supply chains and highlighting the systemic risks posed by maritime chokepoints. [13] The Suez Canal has long been recognised as a strategic asset of paramount importance. Historical analysis reveals that control of the canal has been central to imperial and regional power projection, particularly during the British Empire's dominance, when the canal was viewed as the "jugular vein of empire". [14] The canal's strategic value was dramatically illustrated during the 1956 Suez Crisis and its closure from 1967 to 1975, events that reshaped regional geopolitics and demonstrated how canal access could be weaponized. [15] Contemporary security challenges continue to underscore the canal's strategic vulnerability. Recent geopolitical threats in the Red Sea, including attacks on commercial shipping, have raised concerns about the canal's security and the potential for regional conflicts to disrupt global trade. [16] These hybrid threats demonstrate how the canal remains a potential flashpoint where regional instability can have worldwide economic consequences. [17] In brief, for the time being, the Suez Canal remains an indispensable component of global maritime infrastructure, whose geopolitical significance extends far beyond its physical dimensions. Its role in facilitating international trade, energy transportation, and strategic mobility ensures that the canal's security and accessibility remain matters of vital international interest. As global trade patterns evolve and new challenges emerge, the canal's strategic importance continues to shape relationships among nations and influence the calculus of regional and global powers. Iran-Russia Collaboration. Can INSTC be a viable alternative to the Suez Canal? In December 2025, Iranian and Russian officials met in Tehran to expedite the corridor, focusing on removing administrative barriers and finalising legal frameworks. Key projects include the Rasht-Astara railway (expected completion by mid-2026) and upgrades to Iranian ports, such as Bandar Abbas. [18] Russia and Iran's collaboration is central to operationalising the INSTC, involving joint infrastructure development, financial investments, and policy coordination to address connectivity gaps. [19] It is against this backdrop that Russia has funded the 162-kilometre Rasht-Astara railway in Iran (with a 1.3 billion euro loan, targeted for completion by 2027), which resolves a critical missing link in the western route by connecting Azerbaijan's rail network to Iran's, enabling seamless transit from the Caspian Sea to the Persian Gulf. [20] Iran, in turn, has upgraded ports like Bandar Abbas and Chabahar (the latter through a 10-year agreement with India signed in May 2024, involving $2.1 billion in investments to expand capacity to 8.5 million tonnes), while Russia has modernised Caspian ports such as Astrakhan and Olya, along with highways like the M6 Caspian and M29 Caucasus. These investments — estimated at 35% of total corridor funding from Russia and 34% from Iran — focus on railway electrification, port expansions, and digital tools such as electronic waybills to streamline border procedures, thereby reducing export times and costs, which are currently 5 - 7 times higher than EU averages. Bilateral agreements, such as the 1992 Russia-Iran transport pact and recent multimodal logistics deals (e.g., between Russian Railways and India's CONCOR for coal shipments via INSTC in June 2024), further support asymmetric trade flows, with north-to-south machinery and chemicals dominating from Russia, and south-to-north foodstuffs from Iran. In terms of international trade, this partnership enhances the INSTC's viability by boosting freight potential to 14.6 - 24.7 million tonnes annually by 2030 (including 5.9 - 11.9 million tonnes containerised, or 325 - 662 thousand TEU), with grains accounting for 8.7 - 12.8 million tonnes primarily via the eastern route through Kazakhstan and Turkmenistan. For India, the corridor unlocks untapped export opportunities worth up to $180 billion (nine times current levels) to Russia and Central Asia, while Russia's pivot to southern markets (Gulf, India, Africa) has seen bilateral trade with India surge to over $30 billion in 2022, driven by hydrocarbons. Iran's role as a transit hub could generate transit revenues exceeding oil income, potentially increasing 20-fold from $1 billion to support economic growth amid high inflation (54.6% in 2023) and unemployment (9.7%). Synergies with other corridors like the Baku-Tbilisi-Kars (BTK) and Central Asia Regional Economic Cooperation (CAREC) add 127 - 246 thousand TEU in traffic, fostering Eurasian integration. Geopolitically, Russia-Iran ties make the INSTC a tool to counter Western domination by creating a sanctions-resilient route that avoids U.S.-influenced waterways, especially amid the Ukraine conflict and U.S. sanctions on both nations. This "pivot to the South" by Russia and Iran, and their positioning as a Eurasian bridge, reduce dependence on the Suez Canal, which handles vulnerable global trade, and promote diversified connectivity outside Western frameworks such as TRACECA. Challenges persist, including infrastructure overloads (e.g., 8.8 million tons transported in 2022 despite capacity constraints), uncoordinated policies, gauge differences and sanctions that affect insurance and port access, though exemptions for Chabahar help mitigate these. Overall, the collaboration not only addresses these hurdles through targeted investments and digital harmonisation but also positions the INSTC as a sustainable alternative, with environmental benefits such as 25% lower GHG emissions from rail shifts, comparable to those of deep-sea shipping. How does INSTC serve Russian security interests? In a recent analysis of the subject, Prokhor Tebin offers relevant observations examining the strategic importance of the INSTC within the framework of Russian national security amid intensifying great-power competition. The author argues that Russia’s security and economic resilience depend on developing a cohesive Eurasian transport network through a ‘whole-of-government’ approach that integrates various ministries, regional authorities, and foreign partners. This network includes robust domestic infrastructure and diversified international corridors, with the INSTC being a key route linking Russia to the South Caucasus, Central Asia, and Iran. [21] According to Tebin, Russian national security is defined broadly, encompassing socio-economic development alongside defence. Robust transport infrastructure is vital for economic security, military mobilisation, and rapid crisis response, especially given Russia’s diminished strategic depth and growing threats on multiple borders, including NATO expansion to the west and instability in the south. Against this backdrop, the current overreliance on vulnerable Western transport arteries (the Baltic and Black Seas) underscores the need for alternative routes, such as the INSTC and the Northern Sea Route, to ensure resilience against potential blockades. Furthermore, Tebin stresses the importance of a networked transport system rather than isolated corridors, advocating for coordination via an interdepartmental group to optimise resource allocation and strategic prioritisation. While alternative regional projects exist, such as the Zangezur Corridor and Trans-Caspian routes, Russia should not oppose them outright but seek to enhance its own projects’ competitiveness and foster regional stability, as stable neighbours contribute to Russian security. Iran’s role in the INSTC is pivotal due to its geographic position and economic potential. Supporting Iran’s stability through the corridor reduces regional risks like mass migration and terrorism. The corridor also provides Russia with critical connectivity to the Global South and lessens dependency on NATO-controlled maritime routes. Ultimately, the INSTC, though currently limited in cargo volume, is strategically crucial for diversifying Russia’s transport links, enhancing military and economic security, and fostering Eurasian integration in a complex geopolitical environment characterised by long-term great-power rivalry. Other authors, Vinokurov, Ahunbaev and Zaboev stress the strategic importance and development potential of the INSTC, a multimodal transport network connecting northwestern Europe and the Nordic countries with Central Asia, the Persian Gulf, and South Asia. Accordingly, INSTC serves as a crucial alternative to traditional east-west routes by offering faster delivery times, supporting Eurasian economic integration, and enhancing connectivity for landlocked countries in the Eurasian Economic Union (EAEU), four of whose five members are landlocked. The above-mentioned authors estimate that by 2030, the aggregate freight traffic on the INSTC, including containerised and non-containerised goods, could reach 15 – 25 million tonnes, with container traffic potentially increasing twentyfold. The main commodities transported include food products, metals, machinery, textiles, and grain — the latter being the major non-containerised cargo. The corridor’s rail-based transport offers environmental advantages over road and air freight, emitting significantly fewer greenhouse gases. Despite its potential, INSTC faces several challenges: uncoordinated transport policies among member states, international sanctions (notably on Iran), infrastructure bottlenecks, legal and regulatory inconsistencies, border-crossing delays, and differing railway gauges. Overcoming these issues requires improved coordination, infrastructure investments, digitalisation, and streamlined customs and tariff policies. To sum up, fully operationalising the INSTC would transform it from a mere transport corridor into an economic development corridor, fostering regional connectivity, trade expansion, and sustainable growth across Eurasia. It would also help convert landlocked countries into “land-linked” ones, boosting their economic prospects and integrating them into global value chains. Consequently, it raises questions about the future of the EU as a geopolitical actor within the broader West-BRICS context. Possible consequences for the EU Geoeconomically, INSTC could have significant consequences, centred on trade diversion and supply-chain shifts. The corridor promises 30 – 40% reductions in transit time (e.g., 23 days versus 45 – 60 days via Suez) and costs, enabling faster India–Europe flows of pharmaceuticals, textiles, and machinery, as well as Russian energy and agricultural exports to South Asia. [22] Post-2022 Ukraine invasion, volumes have grown amid Russia’s pivot from European markets, with India–Russia trade surging to around US$50 billion. For the EU, this creates dual pressures: potential cost savings for importers accessing Indian goods or Central Asian resources, yet practical barriers from EU and US sanctions on Russia and Iran, which restrict participation and financing. EU ports and logistics hubs (e.g., Rotterdam) risk losing transit volumes as cargo reroutes through sanctioned territories, while the corridor competes with EU-supported alternatives like the Trans-Caspian Middle Corridor. [23] The EU’s Global Gateway strategy (€300 billion investment framework) explicitly promotes diversified, sustainable connectivity, allocating funds to bypass Russia - and Iran-dependent routes. Cargo between the EU and India is projected to double by 2032 under the prospective FTA, underscoring the need for reliable non-INSTC pathways. Overall, the INSTC accelerates Eurasian trade reorientation away from Western-dominated chokepoints, modestly eroding EU leverage in global logistics while exposing vulnerabilities to disruptions in sanctioned segments. [24] Geopolitically, the INSTC bolsters a Russia–Iran–India axis within BRICS, serving as a sanctions-circumvention tool that undermines the effectiveness of Western measures. By enabling Russia to monetise its geography for access to the Global South and Iran to gain transit rents, it advances multipolar narratives that challenge EU influence in the Caucasus, Central Asia, and the Persian Gulf. [25] For Europe, this reduces coercive leverage over Moscow — previously derived from transit dependence — and fragments the rules-based order the EU champions. It also counters EU efforts to deepen ties with India via transparent initiatives like IMEC, potentially tilting New Delhi’s connectivity choices toward sanctioned partners. Challenges include infrastructure gaps (e.g., rail gauge mismatches, Iranian sanctions-induced delays) and regional conflicts (Armenia – Azerbaijan), limiting scalability. Yet momentum persists through bilateral deals, such as Azerbaijan’s financing for Iran’s Rasht–Astara railway. [26] In conclusion, the INSTC presents the EU with limited opportunities for cheaper diversified trade but primarily poses geoeconomic risks of route competition and geopolitical challenges to sanctions efficacy and Eurasian influence. To mitigate, the EU should probably accelerate Global Gateway investments in the Middle Corridor and IMEC, harmonise sanctions enforcement, and engage India on value-aligned connectivity. Failure to do so could accelerate a shift toward BRICS-led corridors, diminishing the EU’s role in shaping 21st-century Eurasian trade architecture. References [1] International North–South Transport Corridor. (n.d.). Wikipedia. Retrieved October 2, 2026, from https://en.wikipedia.org/wiki/International_North%E2%80%93South_Transport_Corridor [2] Cross-border Infrastructure International North-South Transport Corridor (INSTC). (n.d.). Asia Regional Integration Center. Retrieved October 2, 2026, from https://aric.adb.org/initiative/international-north-south-transport-corridor [3] Vinokurov, E. Y., Ahunbaev, A., & Zaboev, A. I. (2022). International North–South Transport Corridor: Boosting Russia’s “pivot to the South” and Trans-Eurasian connectivity. Russian Journal of Economics, 8(2), 159–173. https://doi.org/10.32609/j.ruje.8.86617 [4] Aliyev, N. (2025, December 19). Russia’s Pivot to the Eastern Route: Balancing Azerbaijan with Kazakhstan and Turkmenistan? Iddle. https://ridl.io/russia-s-pivot-to-the-eastern-route-balancing-azerbaijan-with-kazakhstan-and-turkmenistan/ [5] Wani, A. (2025, November 27). INSTC Eastern Corridor: India’s Gateway to Central Asia. Observer Research Foundation. https://www.orfonline.org/expert-speak/instc-eastern-corridor-india-s-gateway-to-central-asia [6] Bochkarev, D. (2025, November 27). The North–South Transport Corridor and Energy-Related Exports. Energy Intelligence. https://www.energyintel.com/0000019a-c479-d672-a9be-c77f8c740000 [7] International North–South Transport Corridor. (n.d.). Wikipedia. Retrieved October 2, 2026, from https://en.wikipedia.org/wiki/International_North%E2%80%93South_Transport_Corridor [8] Helwa, R., & Al-Riffai, P. (2025, March 20). A lifeline under threat: Why the Suez Canal’s security matters for the world. Atlantic Council. https://www.atlanticcouncil.org/in-depth-research-reports/issue-brief/a-lifeline-under-threat-why-the-suez-canals-security-matters-for-the-world/ [9] Ibidem. [10] Ducruet, C. (2016). The polarization of global container flows by interoceanic canals: geographic coverage and network vulnerability. Maritime Policy & Management, 43(2), 242–260. https://doi.org/10.1080/03088839.2015.1022612 [11] Helwa, R., & Al-Riffai, P. (2025, March 20). A lifeline under threat: Why the Suez Canal’s security matters for the world. Atlantic Council. https://www.atlanticcouncil.org/in-depth-research-reports/issue-brief/a-lifeline-under-threat-why-the-suez-canals-security-matters-for-the-world/ [12] Rodrigue, J.-P. (2005). Straits, Passages and Chokepoints A Maritime Geostrategy of Petroleum Distribution. Erudit, 48(135). https://doi.org/https://doi.org/10.7202/011797ar [13] Lee, J. M., & Wong, E. Y. (2021). Suez Canal blockage: an analysis of legal impact, risks and liabilities to the global supply chain. MATEC Web Conf., 339. https://doi.org/https://doi.org/10.1051/matecconf/202133901019 [14] Morewood, S. (1992). Protecting the Jugular Vein of Empire: The Suez Canal in British Defence Strategy, 1919–1941. War & Society, 10(1), 81–107. https://doi.org/10.1179/072924792791198995 [15] Bhattacharya, S. S. (1982). Strategic Importance of the Suez Canal. Strategic Analysis, 5(12), 686–693. https://doi.org/10.1080/09700168209427575 [16] Kotait, A., & Ismail, A. (2025). Geopolitical Threats in the Red Sea: The Future of the Suez Canal amid Regional and International Challenges. EKB Journal Management System. https://doi.org/10.21608/jces.2025.435103 available here: https://www.researchgate.net/publication/393195669_Geopolitical_Threats_in_the_Red_Sea_The_Future_of_the_Suez_Canal_amid_Regional_and_International_Challenges [17] Lott, A. (2022). Hybrid Threats and the Law of the Sea Use of Force and Discriminatory Navigational Restrictions in Straits. Brill. https://doi.org/https://doi.org/10.1163/9789004509368 [18] Iran, Russia Push To Fast-Track North-South Trade Corridor. (2025, December 17). The Media Line. https://themedialine.org/headlines/iran-russia-push-to-fast-track-north-south-trade-corridor/#:~:text=Iran%20and%20Russia%20announced%20that%20they%20aim,Pushing%20the%20project%20into%20an%20operational%20phase [19] Vinokurov, E. Y., Ahunbaev, A., & Zaboev, A. I. (2022). International North–South Transport Corridor: Boosting Russia’s “pivot to the South” and Trans-Eurasian connectivity. Russian Journal of Economics, 8(2), 159–173. https://doi.org/10.32609/j.ruje.8.86617 [20] Rawandi-Fadai, L. (2023, August 3). What North-South International Transport Corridor Means for Iran. RIAC Russian International. https://russiancouncil.ru/en/analytics-and-comments/analytics/what-north-south-international-transport-corridor-means-for-iran/ [21] Tebin, P. Y. (2026). The International North–South Transport Corridor in Russian National Security Optics. Russia in Global Affairs, 24(1), 134–148. https://doi.org/10.31278/1810-6374-2026-24-1-134-148 Vinokurov, E. Y., Ahunbaev, A., & Zaboev, A. I. (2022). International North–South Transport Corridor: Boosting Russia’s “pivot to the South” and Trans-Eurasian connectivity. Russian Journal of Economics, 8(2), 159–173. https://doi.org/10.32609/j.ruje.8.866171 [22] Fillingham, Z. (2024, September 10). Geopolitics of the International North-South Transport Corridor (INSTC). Geopolitical Monitor. https://www.geopoliticalmonitor.com/geopolitics-of-the-international-north-south-transport-corridor-instc/ [23] Kausch, K. (2026, February 11). Corridor Politics. Charting Europe’s de-risking route through Eurasia. G M F. https://www.gmfus.org/news/corridor-politics [24] Ghanem, D., & Sánchez-Cacicedo, A. (2024, June 18). From hype to horizon: what the EU needs to know to bring IMEC to life. European Union Institute for Security Studies. https://www.iss.europa.eu/publications/briefs/hype-horizon-what-eu-needs-know-bring-imec-life [25] Kausch, K. (2026, February 11). Corridor Politics. Charting Europe’s de-risking route through Eurasia. G M F. https://www.gmfus.org/news/corridor-politics [26] Delivorias, A., & Falkenberg, D. (2024). India's connectivity initiatives: A multi-faceted strategy (EPRS Briefing No. PE 762.471). European Parliamentary Research Service. https://www.europarl.europa.eu/thinktank/en/document/PE-762.471